
Markets & Economy
Hard to believe that the dog days of summer are upon us and by the time you receive next month’s newsletter Labor Day will have come and gone. For those of us in the North, the summer months seem way too short.
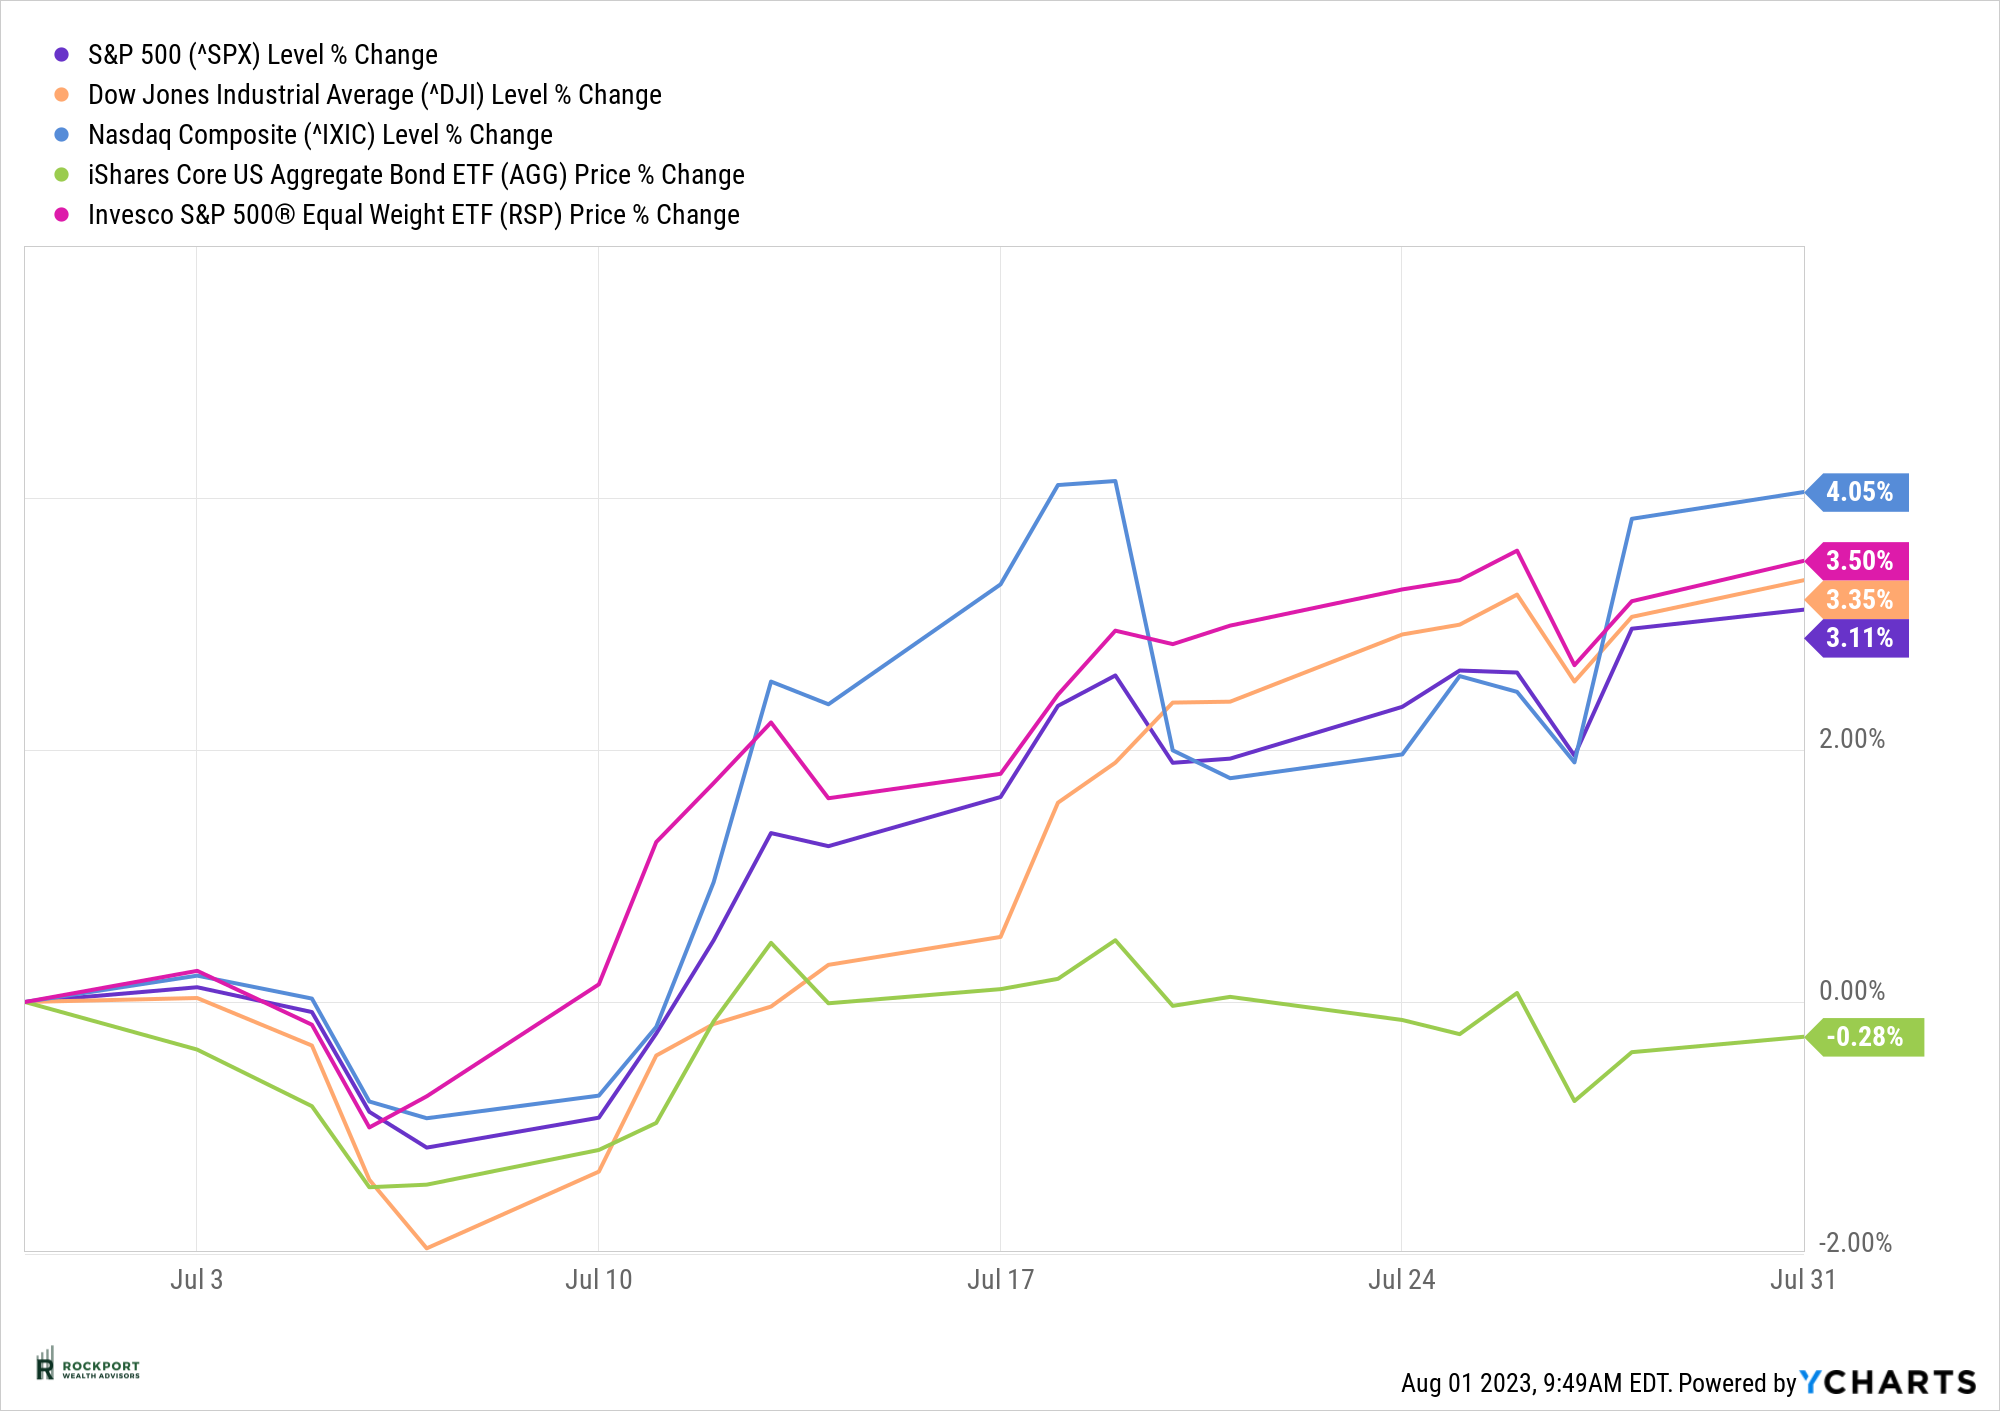
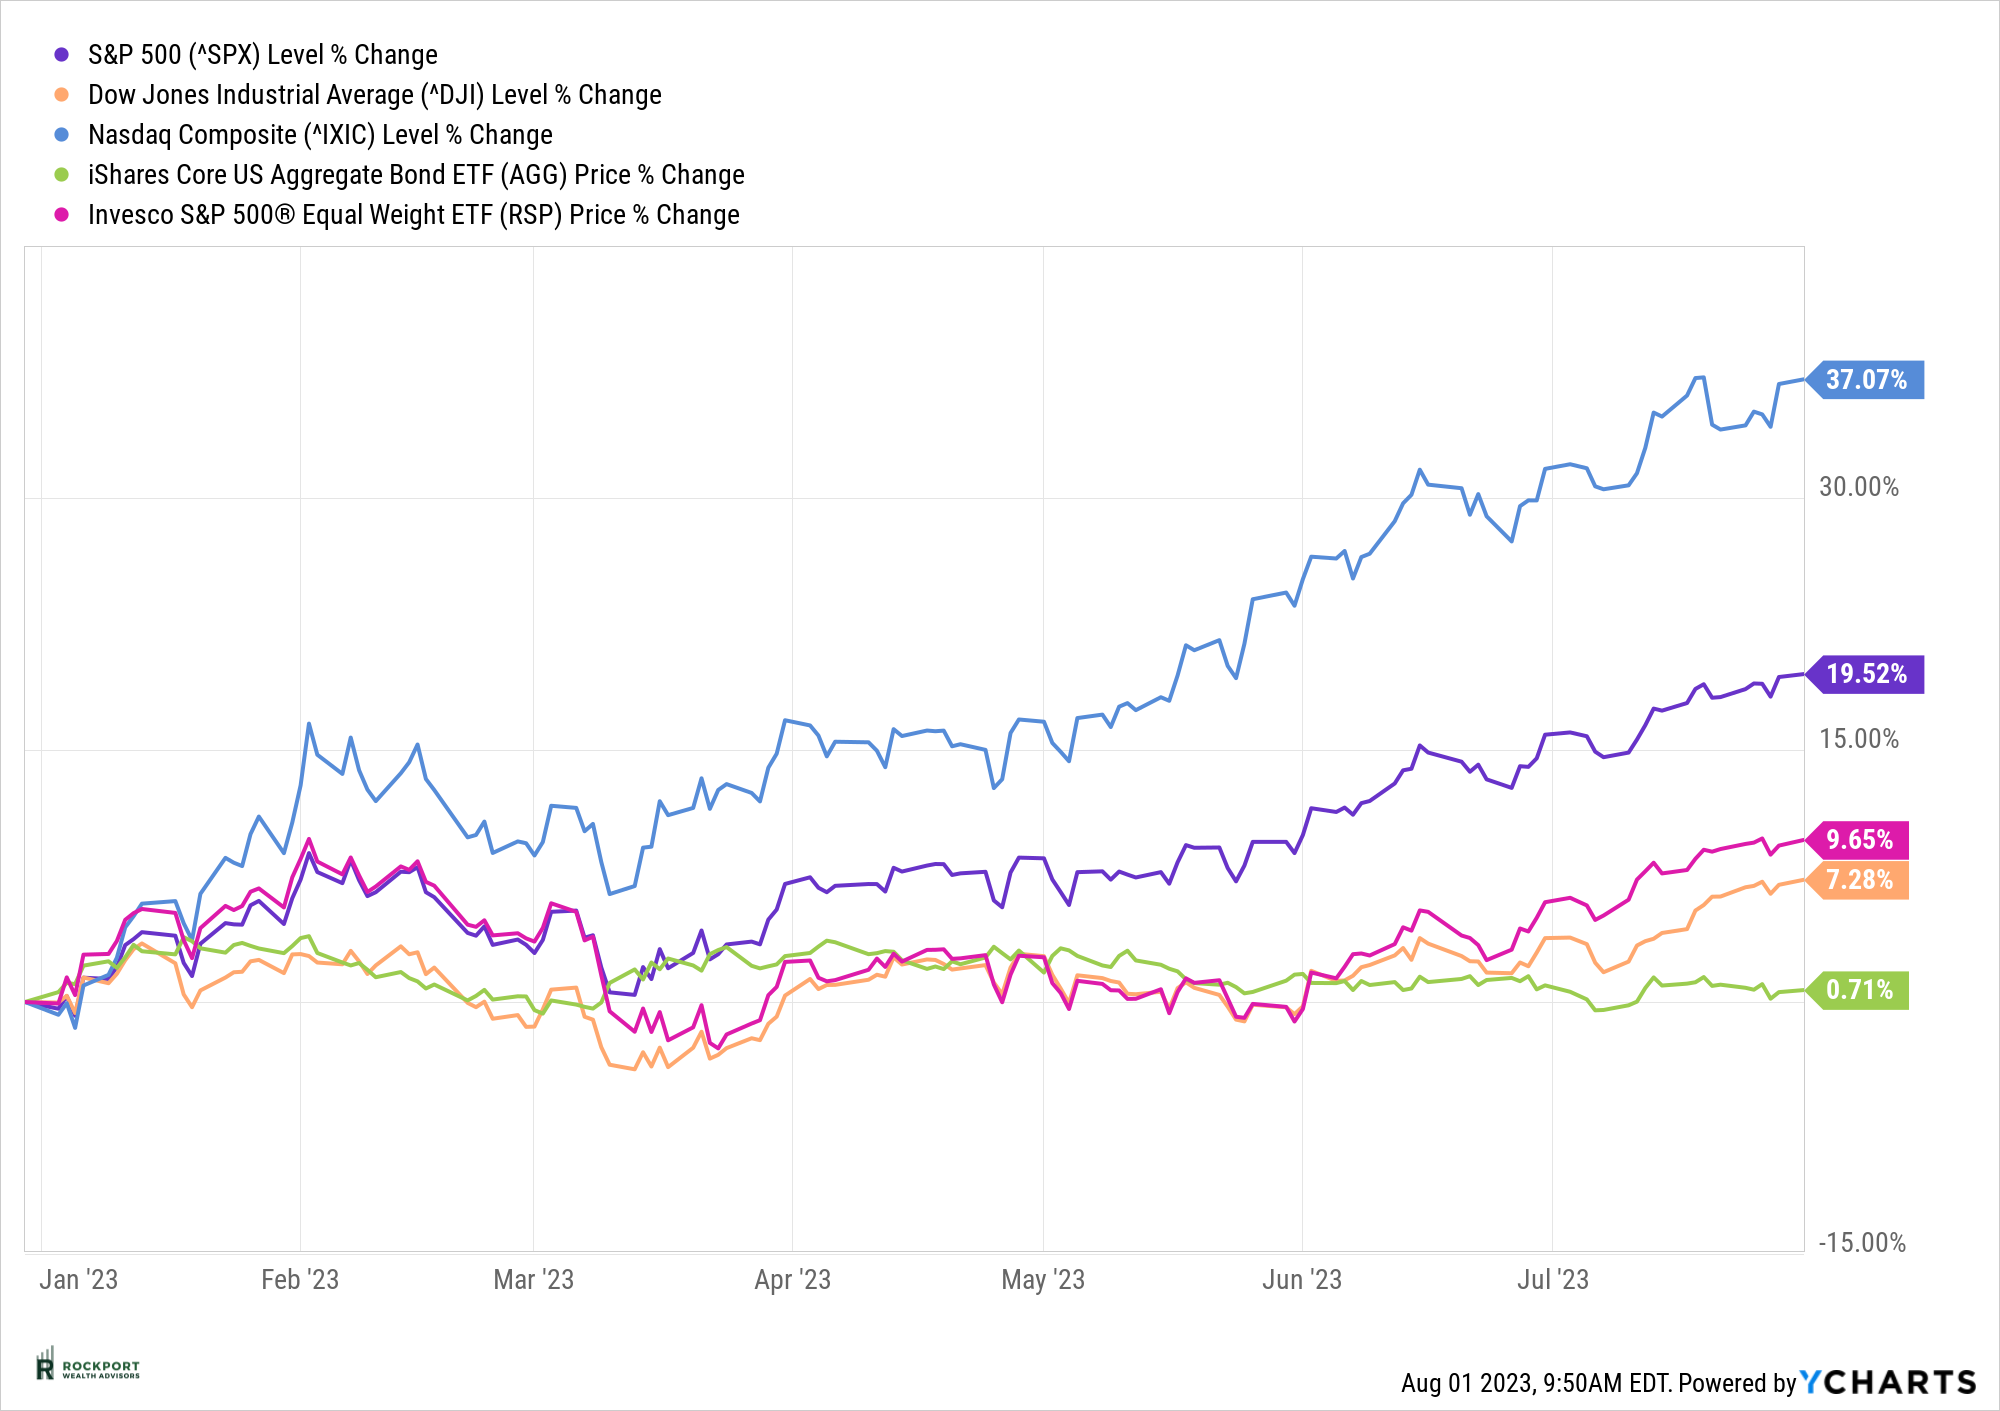
The beat goes on as the S&P 500 was up 3.11% for the month. With yet another positive month the index now stands at + 19.30% year to date. The story has not changed significantly in that a small handful of stocks are still driving performance year to date. However, for the first time in a long time the S&P 500 Equal weight did slightly outperform the standard S&P 500 index which is a sign that the market is trying to broaden out a bit.
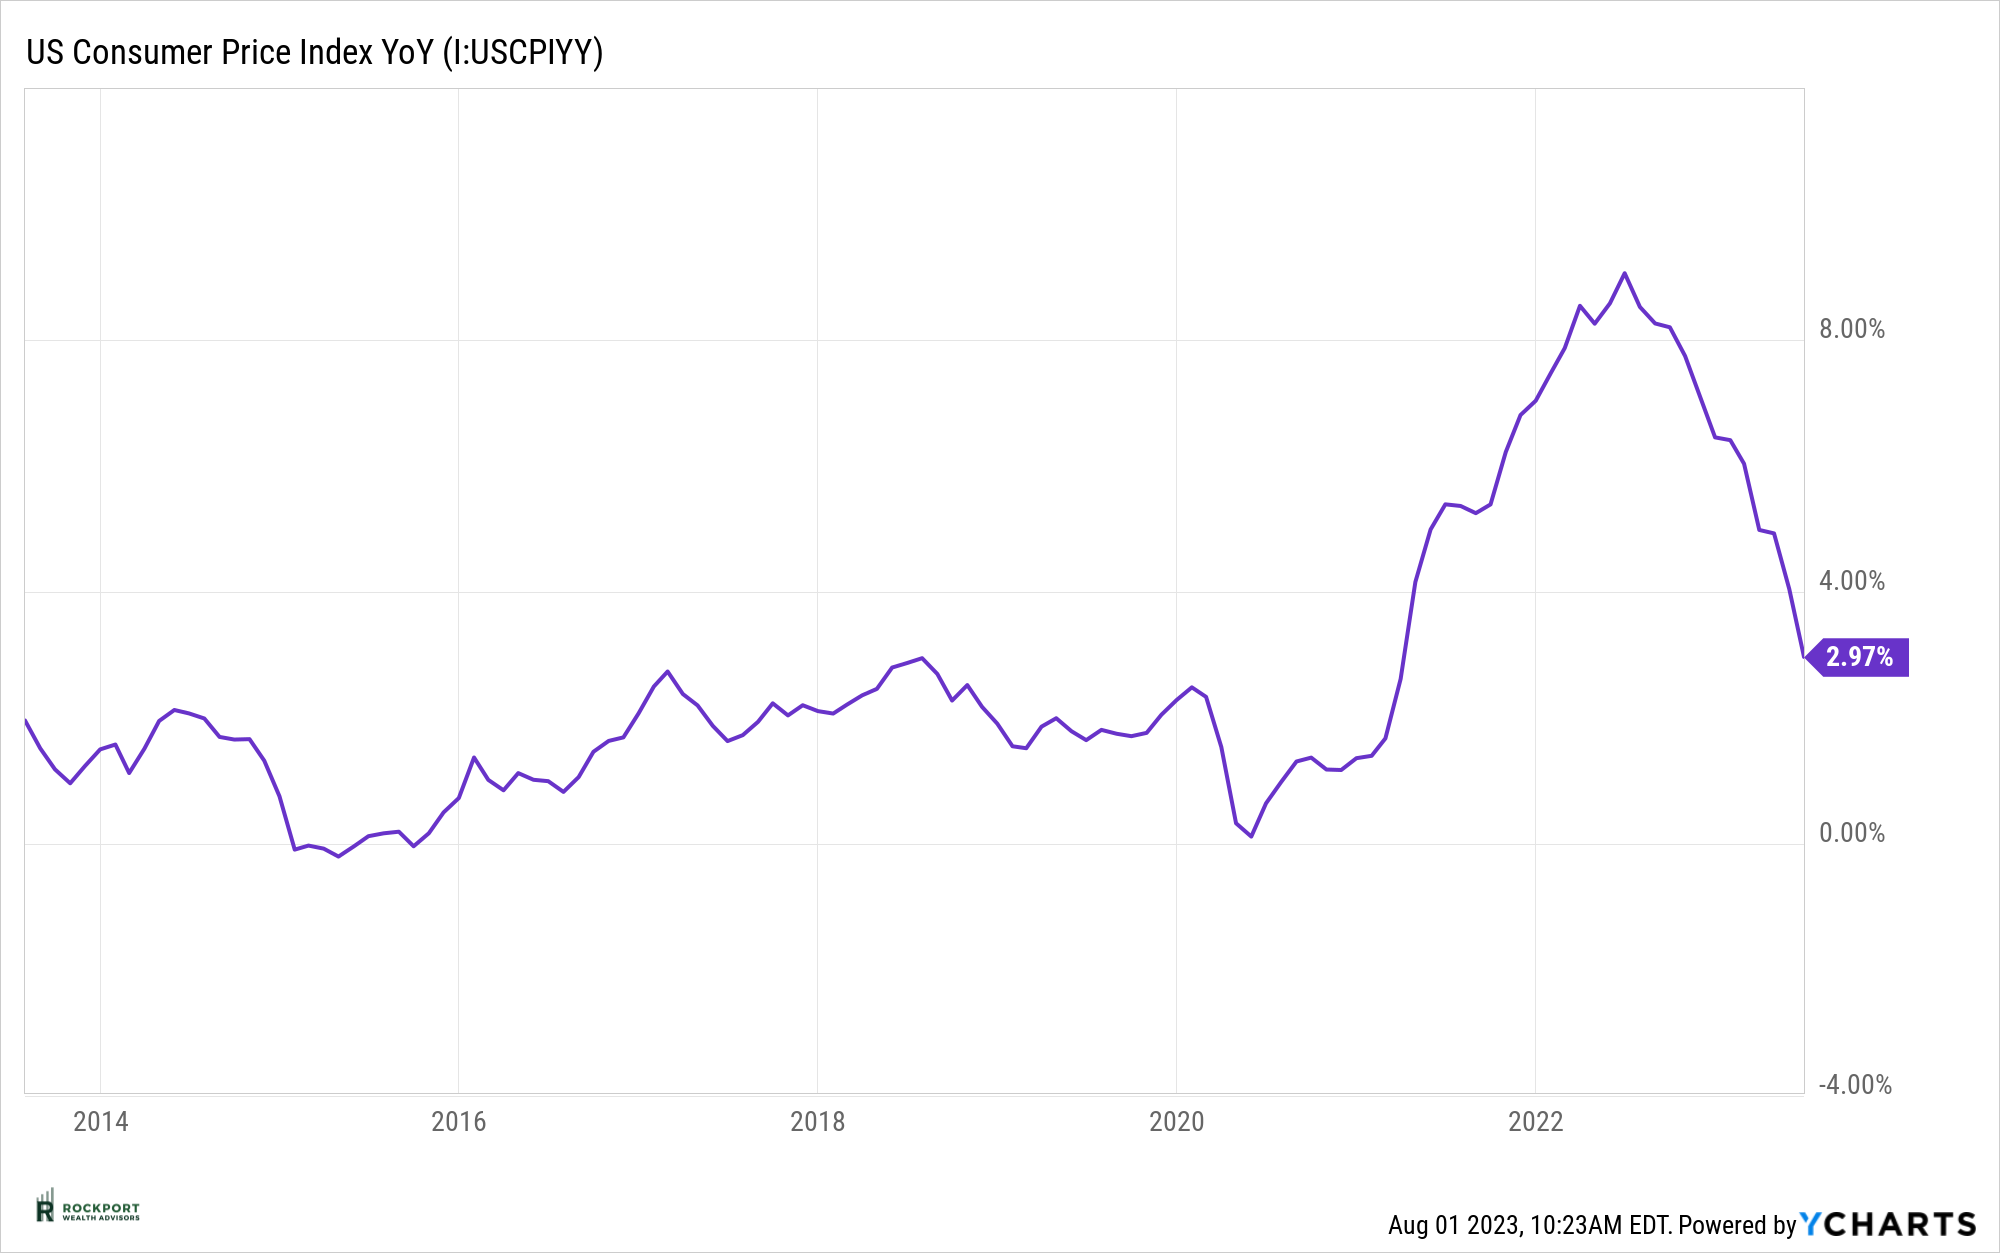
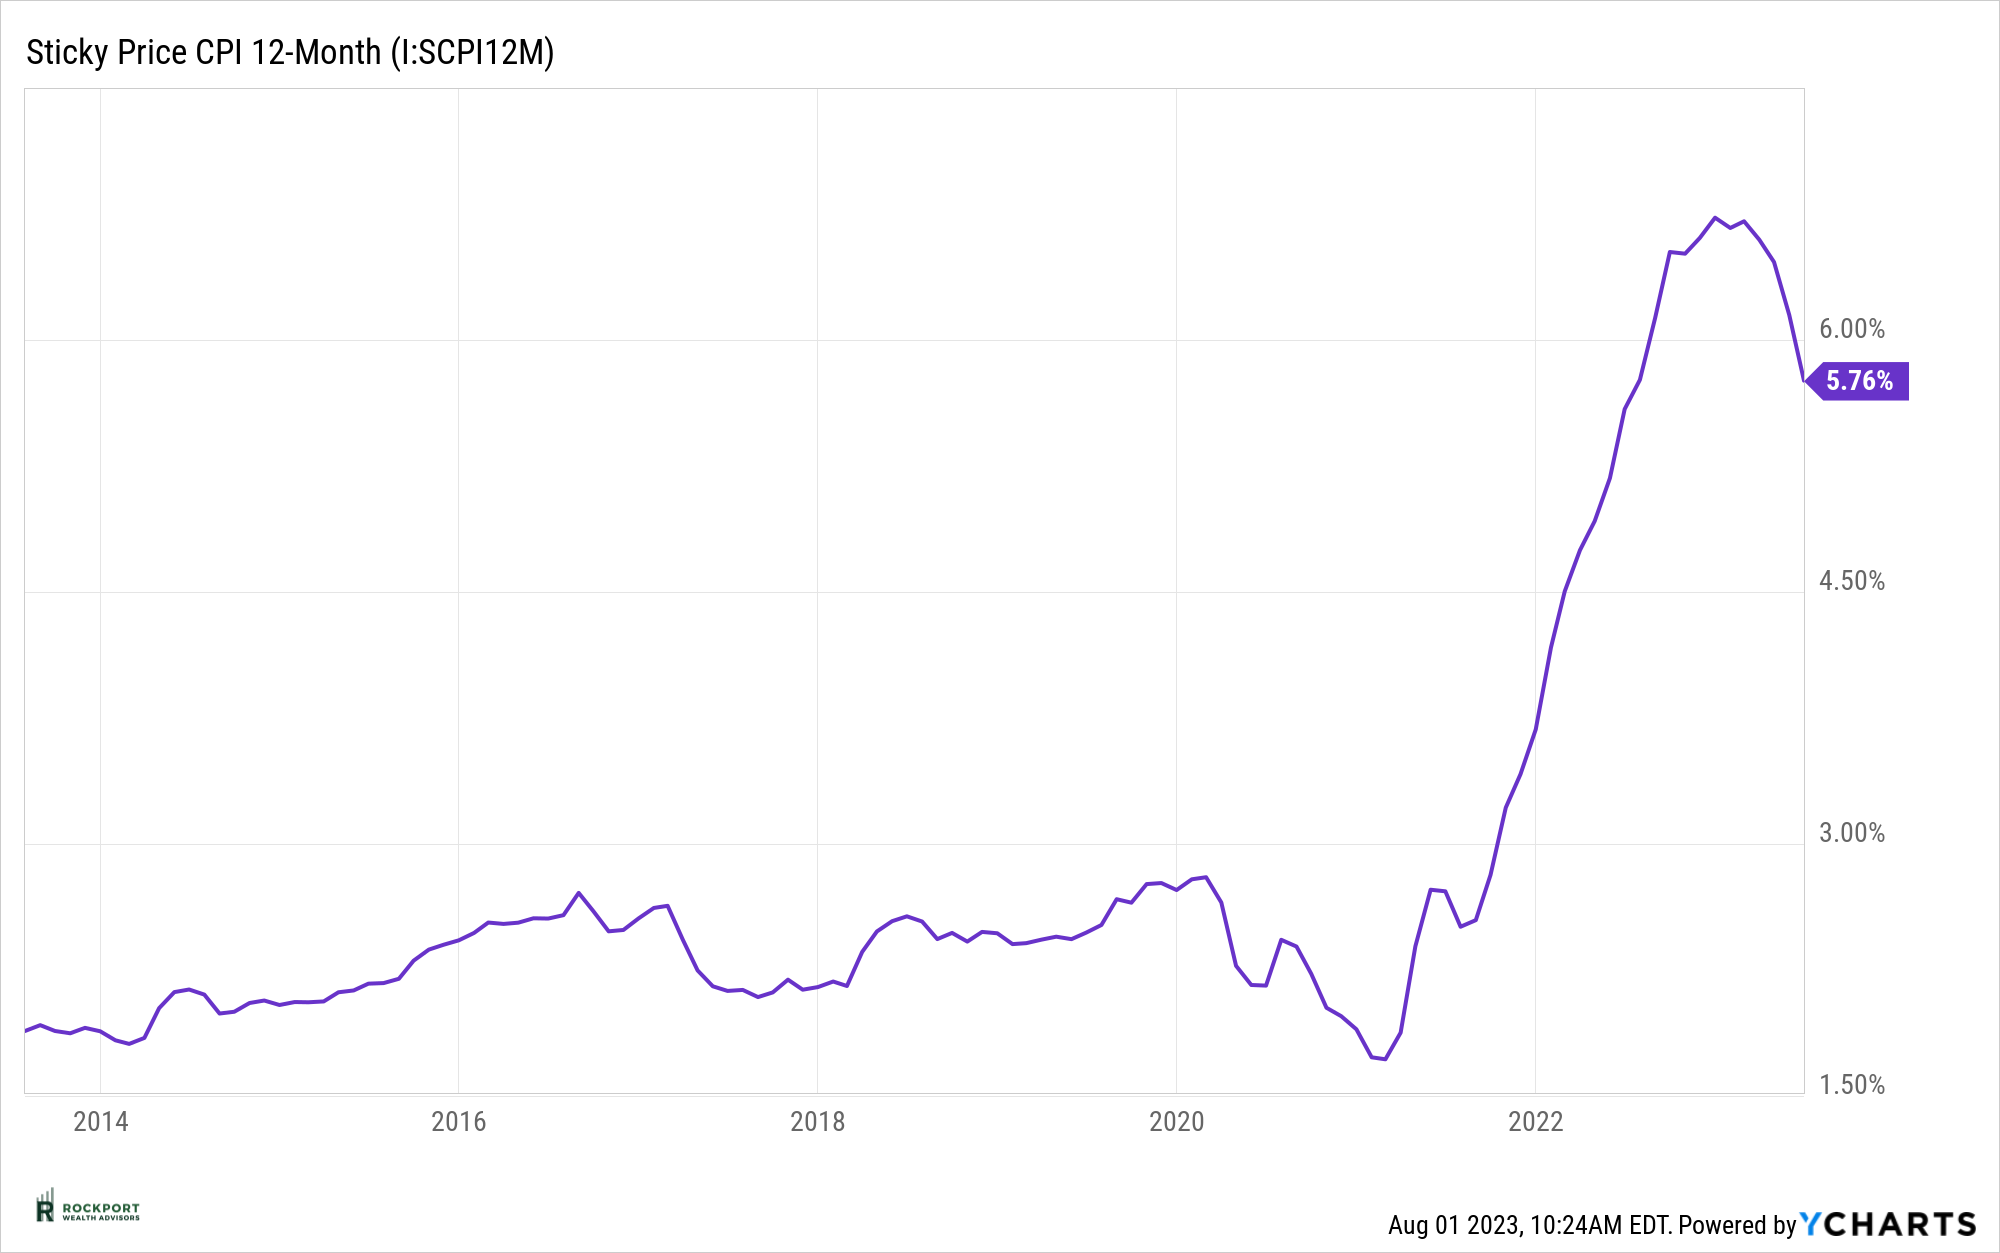
Inflation has continued to drop as the CPI (Consumer Price Index) is now at 2.97%. Just a year ago inflation as measured by the index was well over 8%. While not as dramatic a fall, Sticky CPI fell slightly to 5.76%. However, it is worth noting that in the past couple of months prices have increased on items such as oil, gas, cocoa, soybeans, cattle and hogs. Clearly not a good sign for food prices.
So, what keeps us up at night and why are we maintaining a cautious tone now that inflation has fallen?
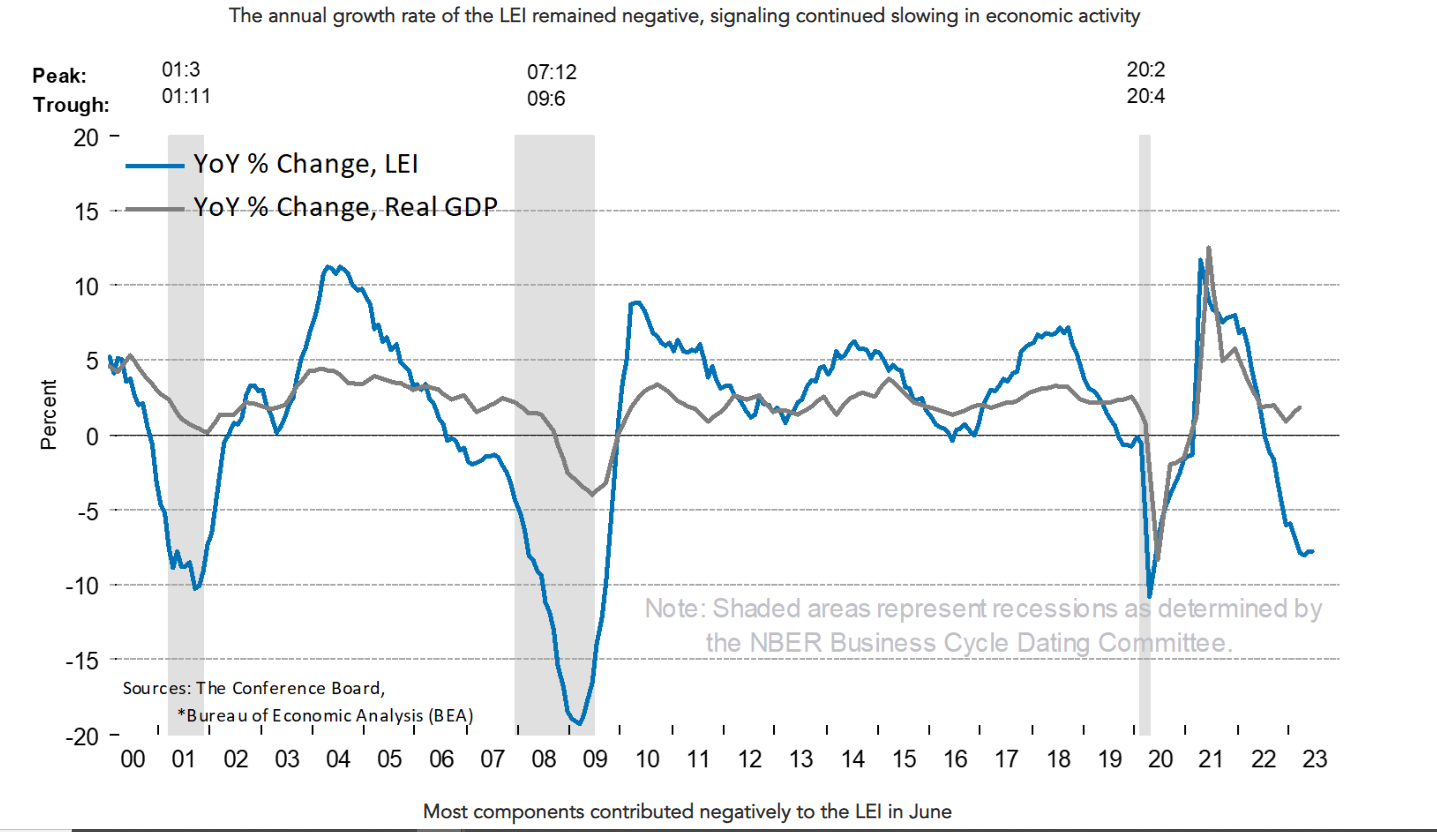
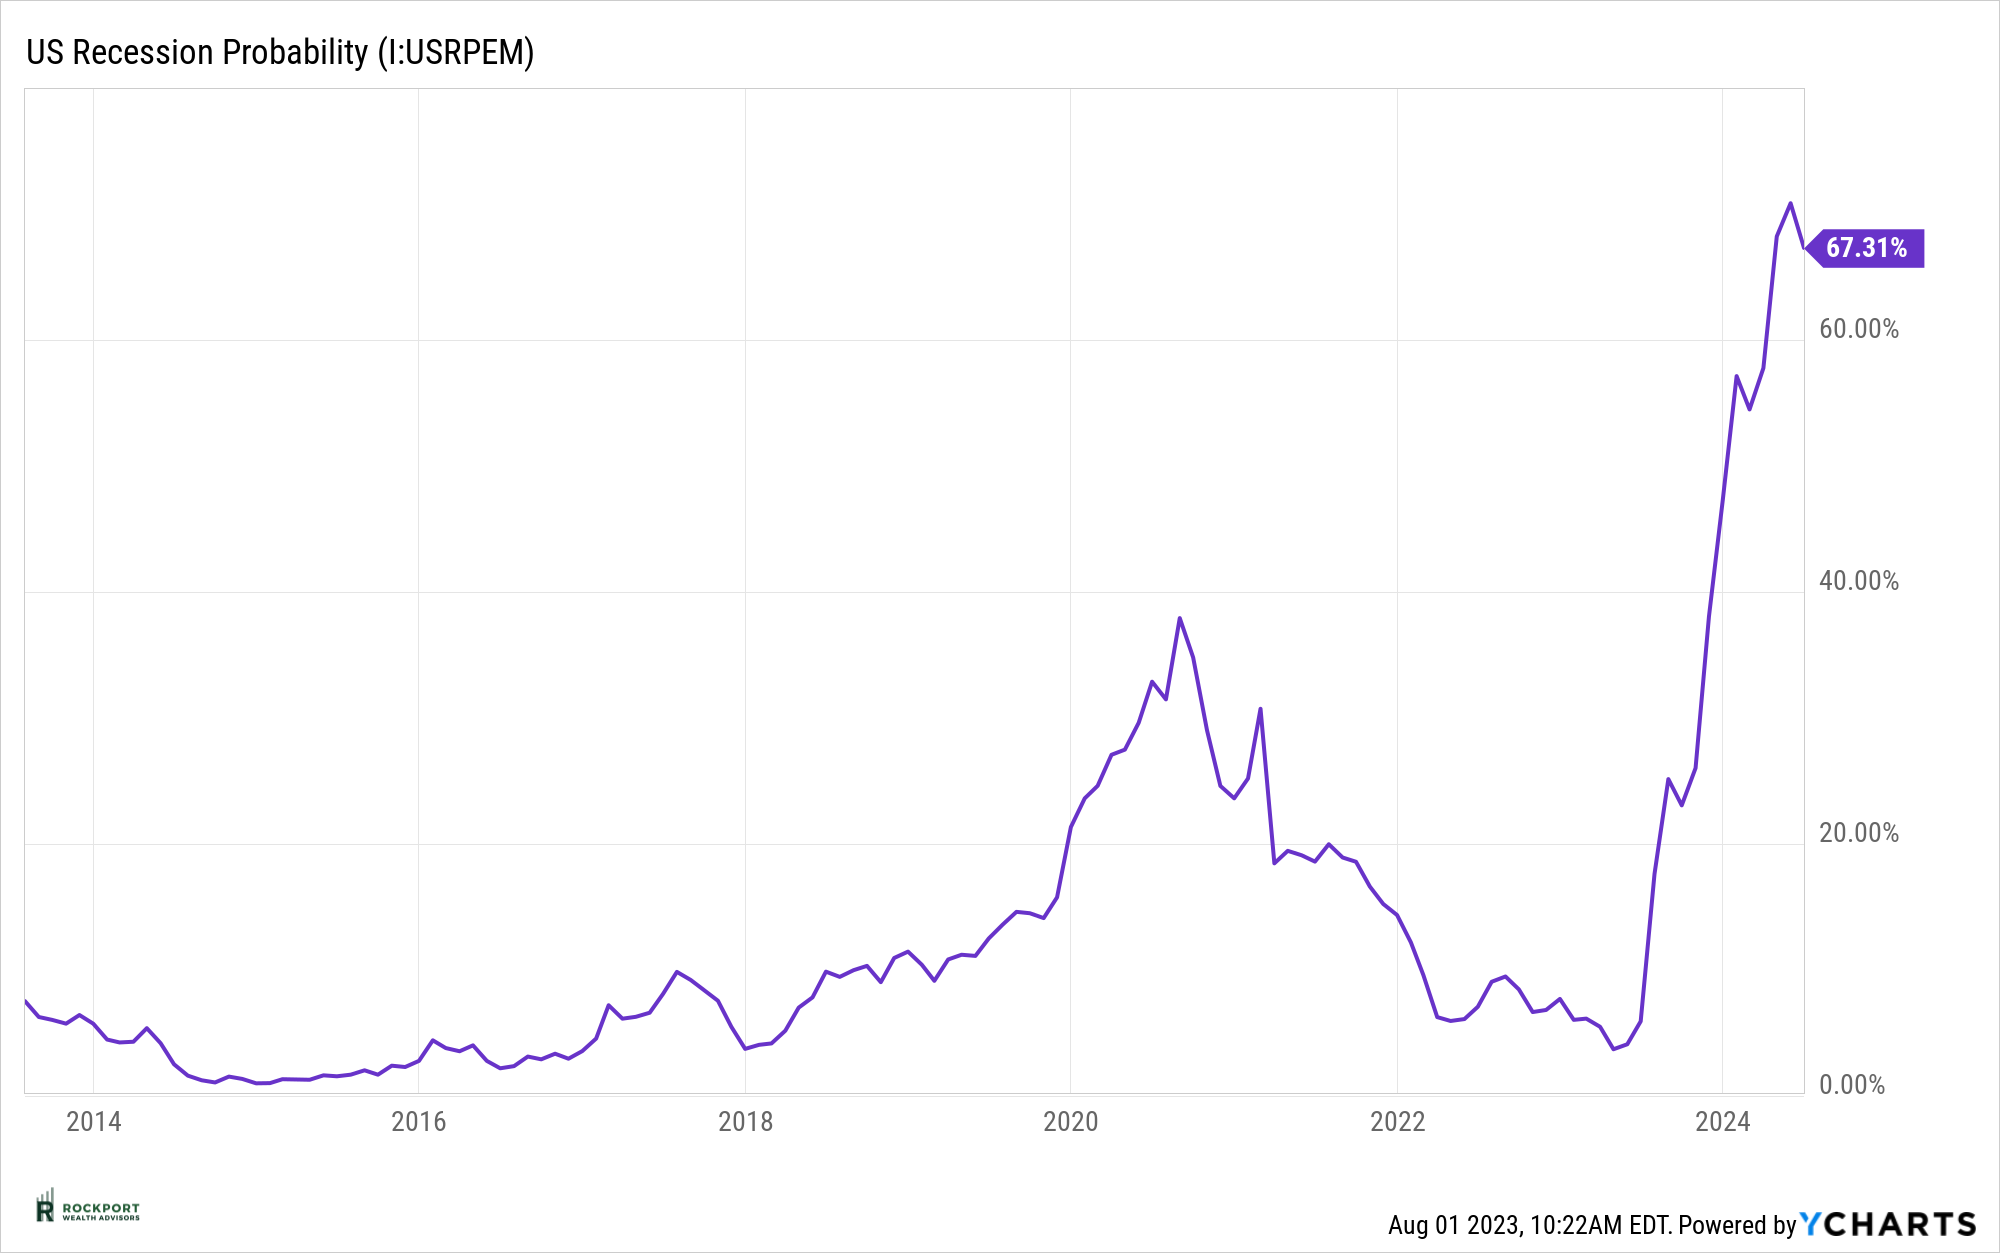
First, remember all those interest rate increases in 2022? There is a lag in monetary policy (more later in industry topics) and we don’t yet know the outcome of the effects on the economy after such an aggressive rate hiking cycle. Second, recessionary data points that have a high batting average of being correct still strongly signal a recession is likely. The LEI (Leading Economic Index) has now reached a new low 15 months in a row and the yield curve remains inverted. The current recession probability model from the New York Fed has declined slightly but is still the highest on record. Third, as stated above, many inflationary components have reinflated in the past couple months. Might the inflation decline of the past 12 months be in for a reversal? Fourth, FOMO (fear of missing out) has gripped the markets again and even bad news this year has made certain stocks go up as investors fear being left behind in a market rally. Generally speaking this psychological phenomenon is not healthy and is considered market chasing short term vs true investing for the long term. It is also part of the reason that a small group of stocks has seen so much momentum. Fifth, equity valuations are noticeably overvalued relative to interest rates, i.e., on a historical basis the market is expensive. Lastly, and this one seemingly came out of nowhere, there was a downgrade of US debt by ratings agency Fitch on August 1st, and we don’t know what ramifications, if any, that may bring with it.
Safe to say there is plenty to keep an eye on and a lot that needs to unfold over the final months of the year and into Q1 next year. If you are turning to the media for information, the best suggestion is to turn it off. Financial TV experts were bullish in December of 2021, Bearish in December of 2022 and now are very Bullish in July of 2023. Looking back if anything this appears to be a think the opposite of what they are saying idea. You are best off focusing on investing as a multiyear process and looking at your investments from your own personal goals and plan.
Rockport Models
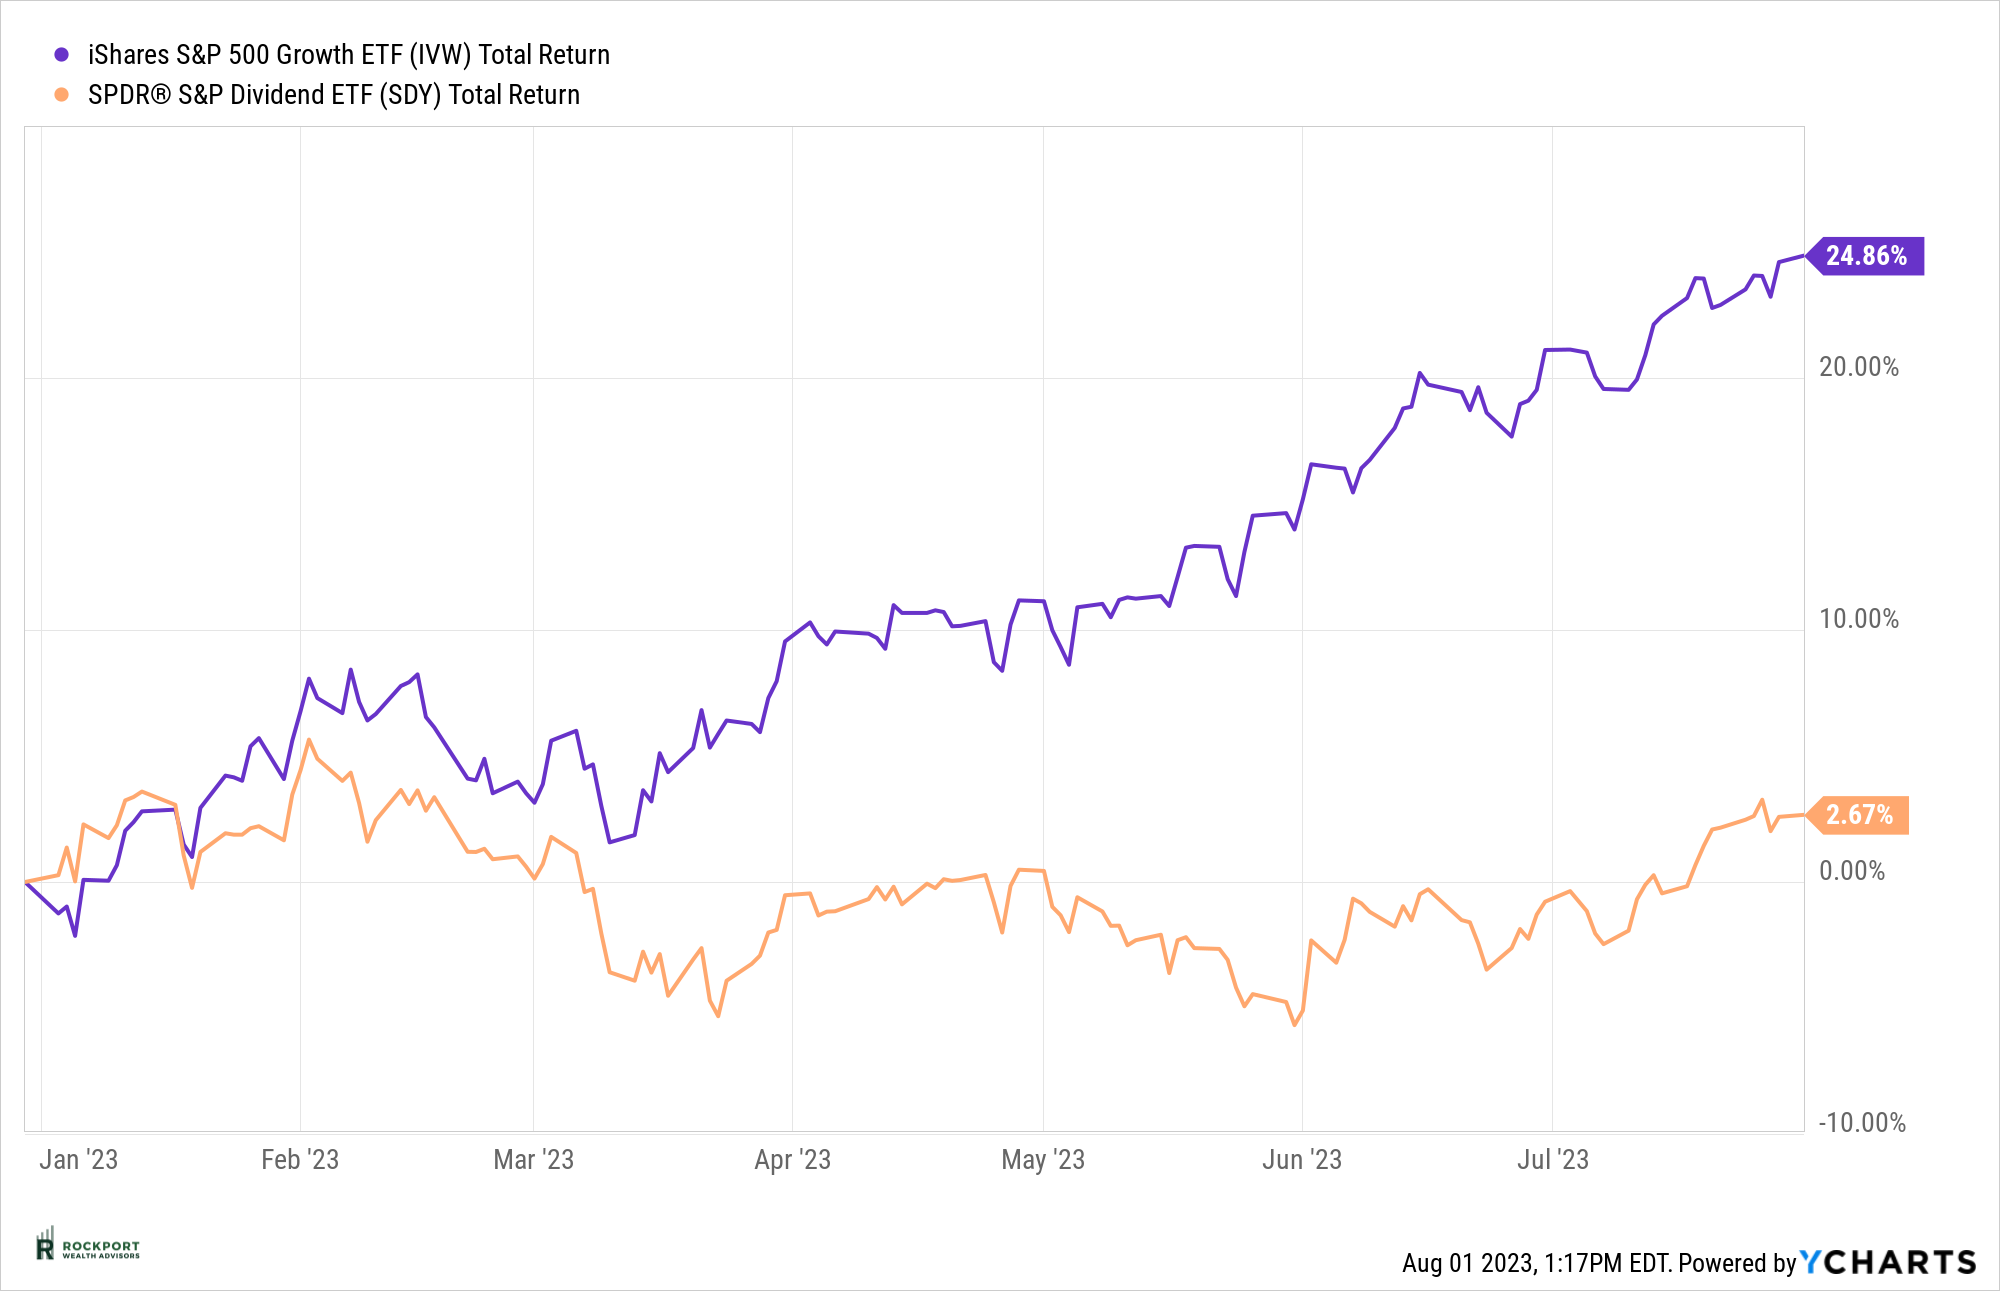
We did make several changes to our Sector model during the month. We reduced the Invesco Equal Weight Technology ETF (RSPT) from 6% to 4%. This is nothing more than taking a bit of profit off the table after a sizeable run in this sector. We also fully sold out of the Communications Sector ETF (XLC) for similar reasons. Lastly, we started a new position in the Proshares S&P 500 Dividend Aristocrat ETF (NOBL) the reason being that Dividend paying stocks have largely lagged this year and are being ignored by investors and as a group are cheap comparatively speaking. The model is now 51% invested in various stock sectors and 49% invested in a money market.
Industry Topics
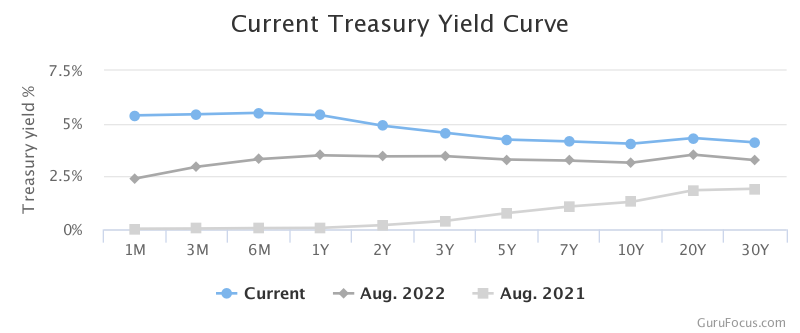
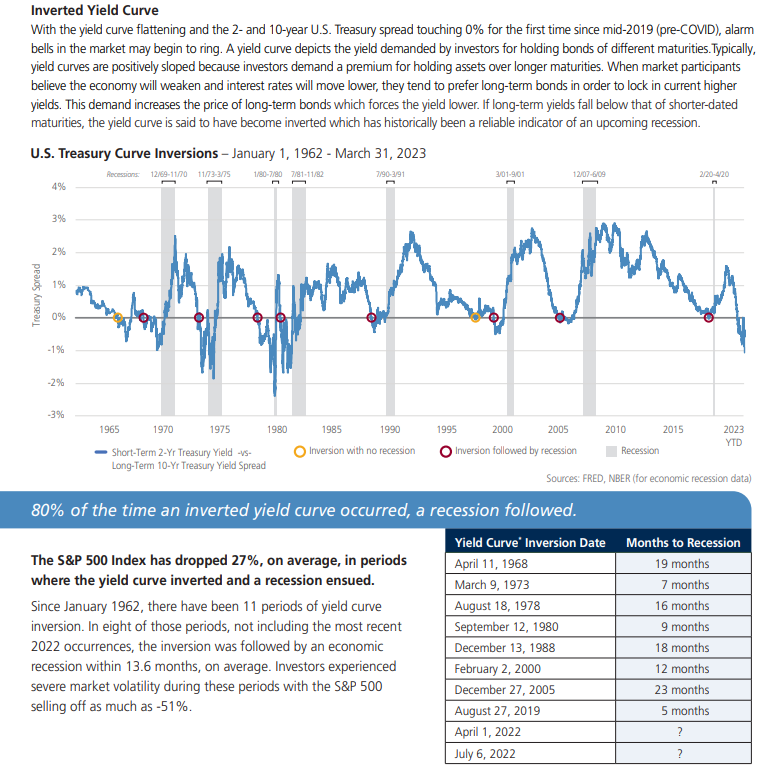
Monitoring the inverted yield curve
Following up on our topic of last month on what is an inverted yield curve, this month we will show why we watch this indicator so closely. As you can see in the chart below as noted by the small red circles, recessions, the large grey bars, are very common, although not a certainty, anywhere from 5 to 23 months after the yield curve inverts. Since the yield curve inverted in April 2022, un-inverted and then reinverted in July 2022, we are entering the sweet spot of likelihood of recession in the next 6 months. Again, nothing is certain, but the economic data certainly bears close watch in the months ahead. A big Thank you to our friends at LoCorr Investments for providing the data.
Rockport News
It’s almost here!
Our 3rd Annual Salute to Service Golf Outing which benefits several Veteran Organizations is scheduled for Monday August 14th. Once again it will be held at Red Tail Golf Club in the Cleveland Area. Details on participating or donating can be found at Salutetoservicegolf.com. It would be great to see as many clients and friends of Rockport attend as possible.
As always, if you have any questions on anything we have talked about here or anything else that is on your mind, please feel free to reach out.
*The Standard & Poor’s 500 (S&P 500) is an unmanaged group of securities considered to be representative of the stock market in general. Results can be found at slickcharts.com.
*Treasury yields can be found at finance.yahoo.com.
*Charts produced at yCharts.com
*Bonds can be found at bloomberg.com/markets/rates-bonds
*Fed Rate Probability Chart can be found at cmegroup.com/markets/interest-rates/cme-fedwatch-too
*The LEI can be found at conference-board.org/topics/us-leading-indicators
*Treasury Yield Curve can be found at Gurufocus.com