
Markets & Economy
We hope you all had a nice Labor Day weekend and got to spend some quality time with friends and family.
Historically August and September have been two of the worst months for the stock market with September leading the way as the worst. Several theories exist as to why this is the case including low trading volumes around the end of summer due to last minute vacations, a focus on non-market related activities by traders, and another being that many mutual funds have their fiscal year end at the end of September and tend to sell winning stocks to lock in gains. There are probably several other reasons, some rational and some irrational, that can be attributed to this but it’s safe to say we are not in a seasonally strong time for the market.
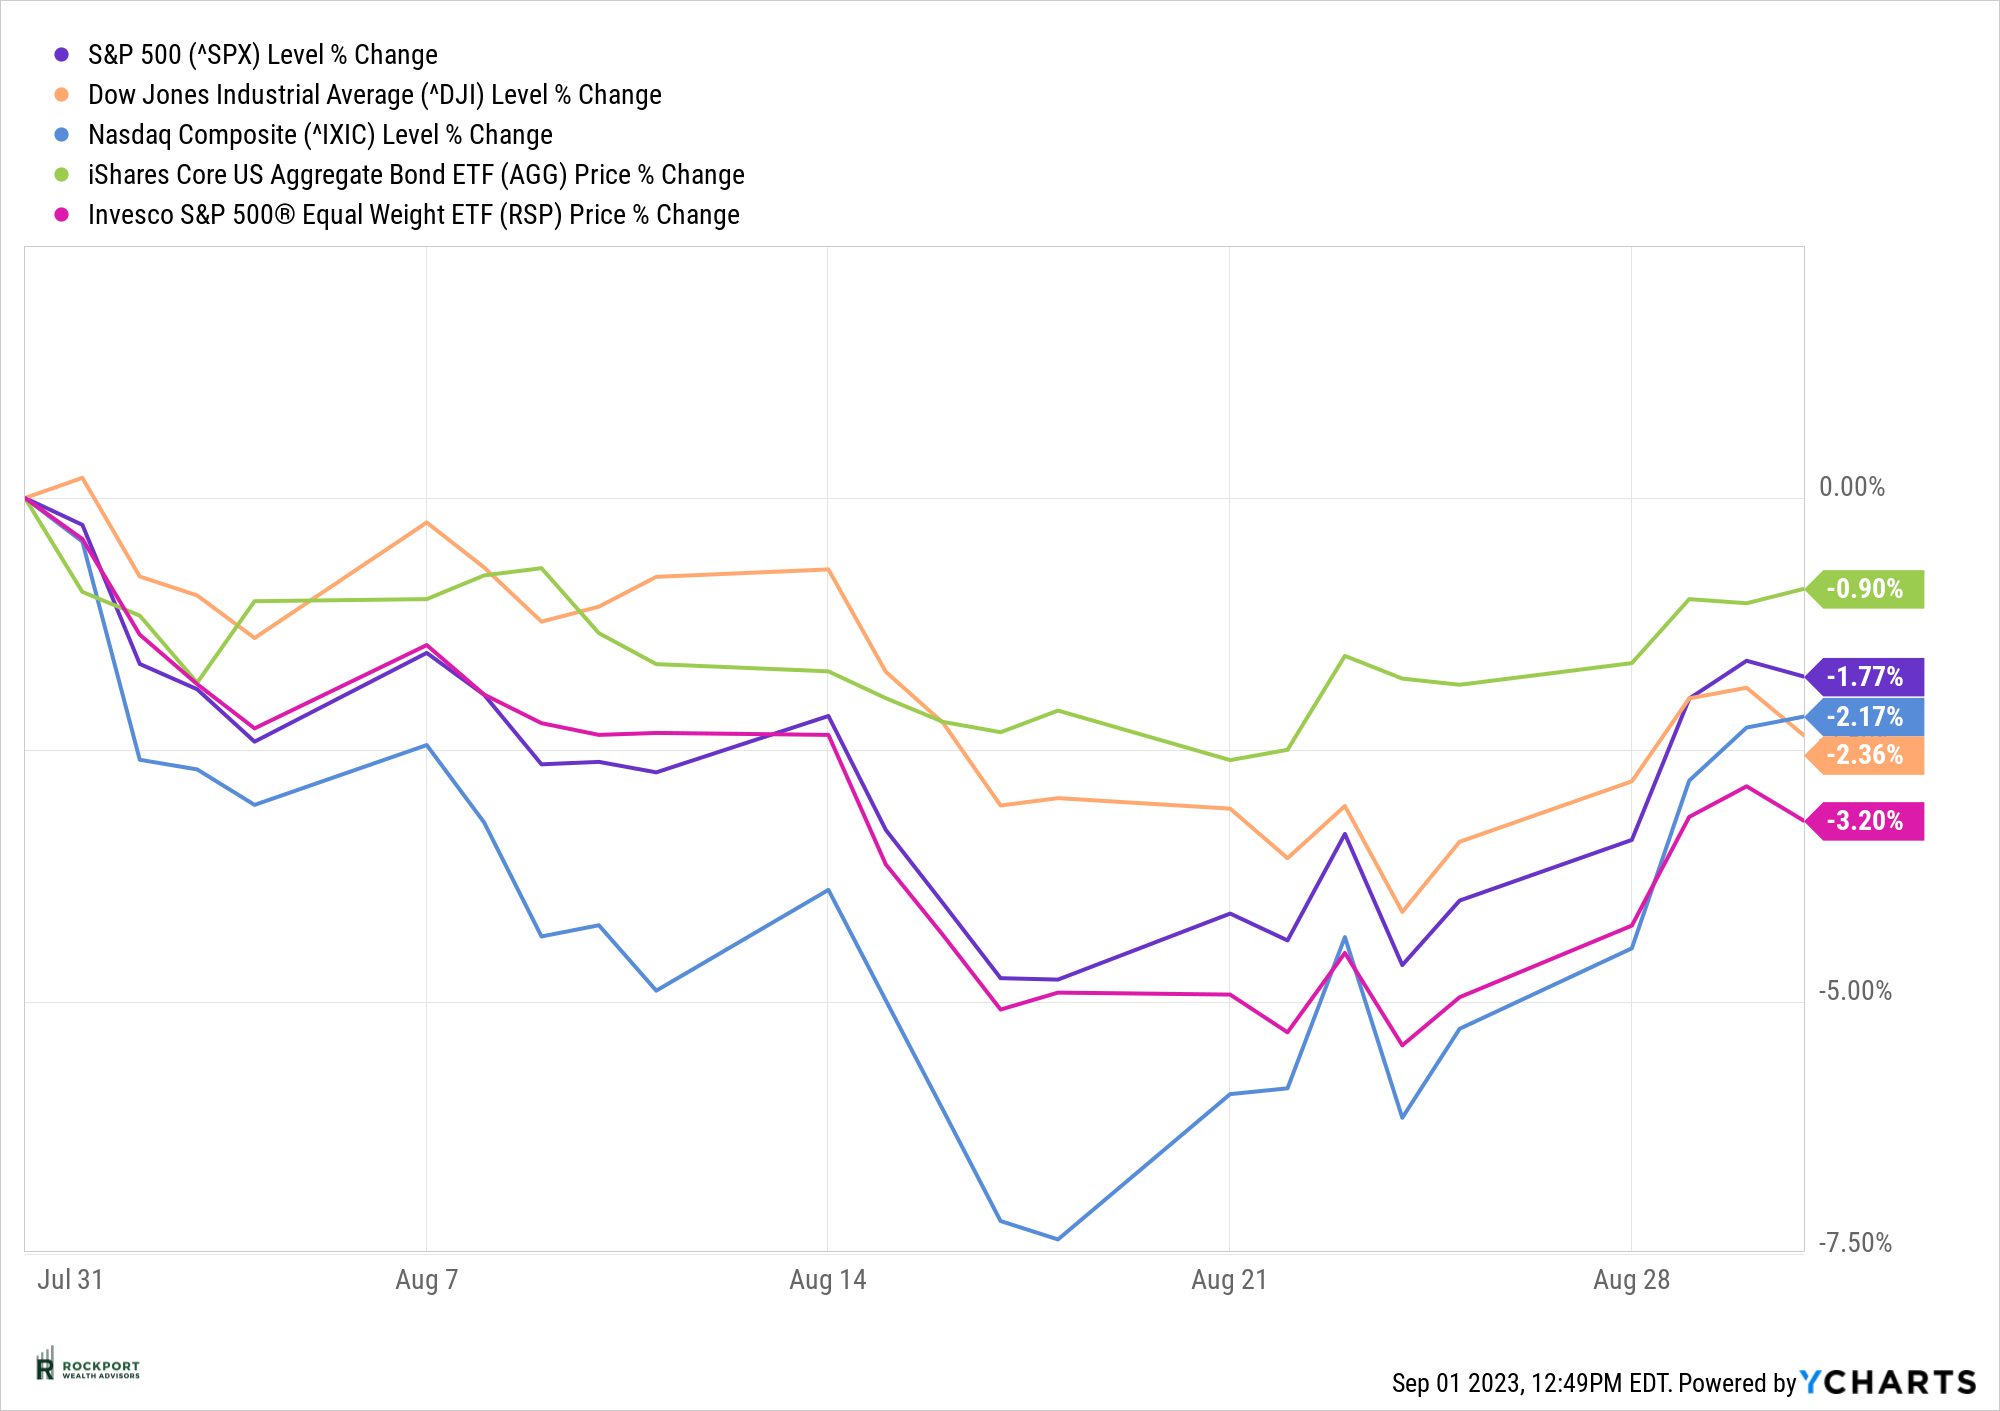
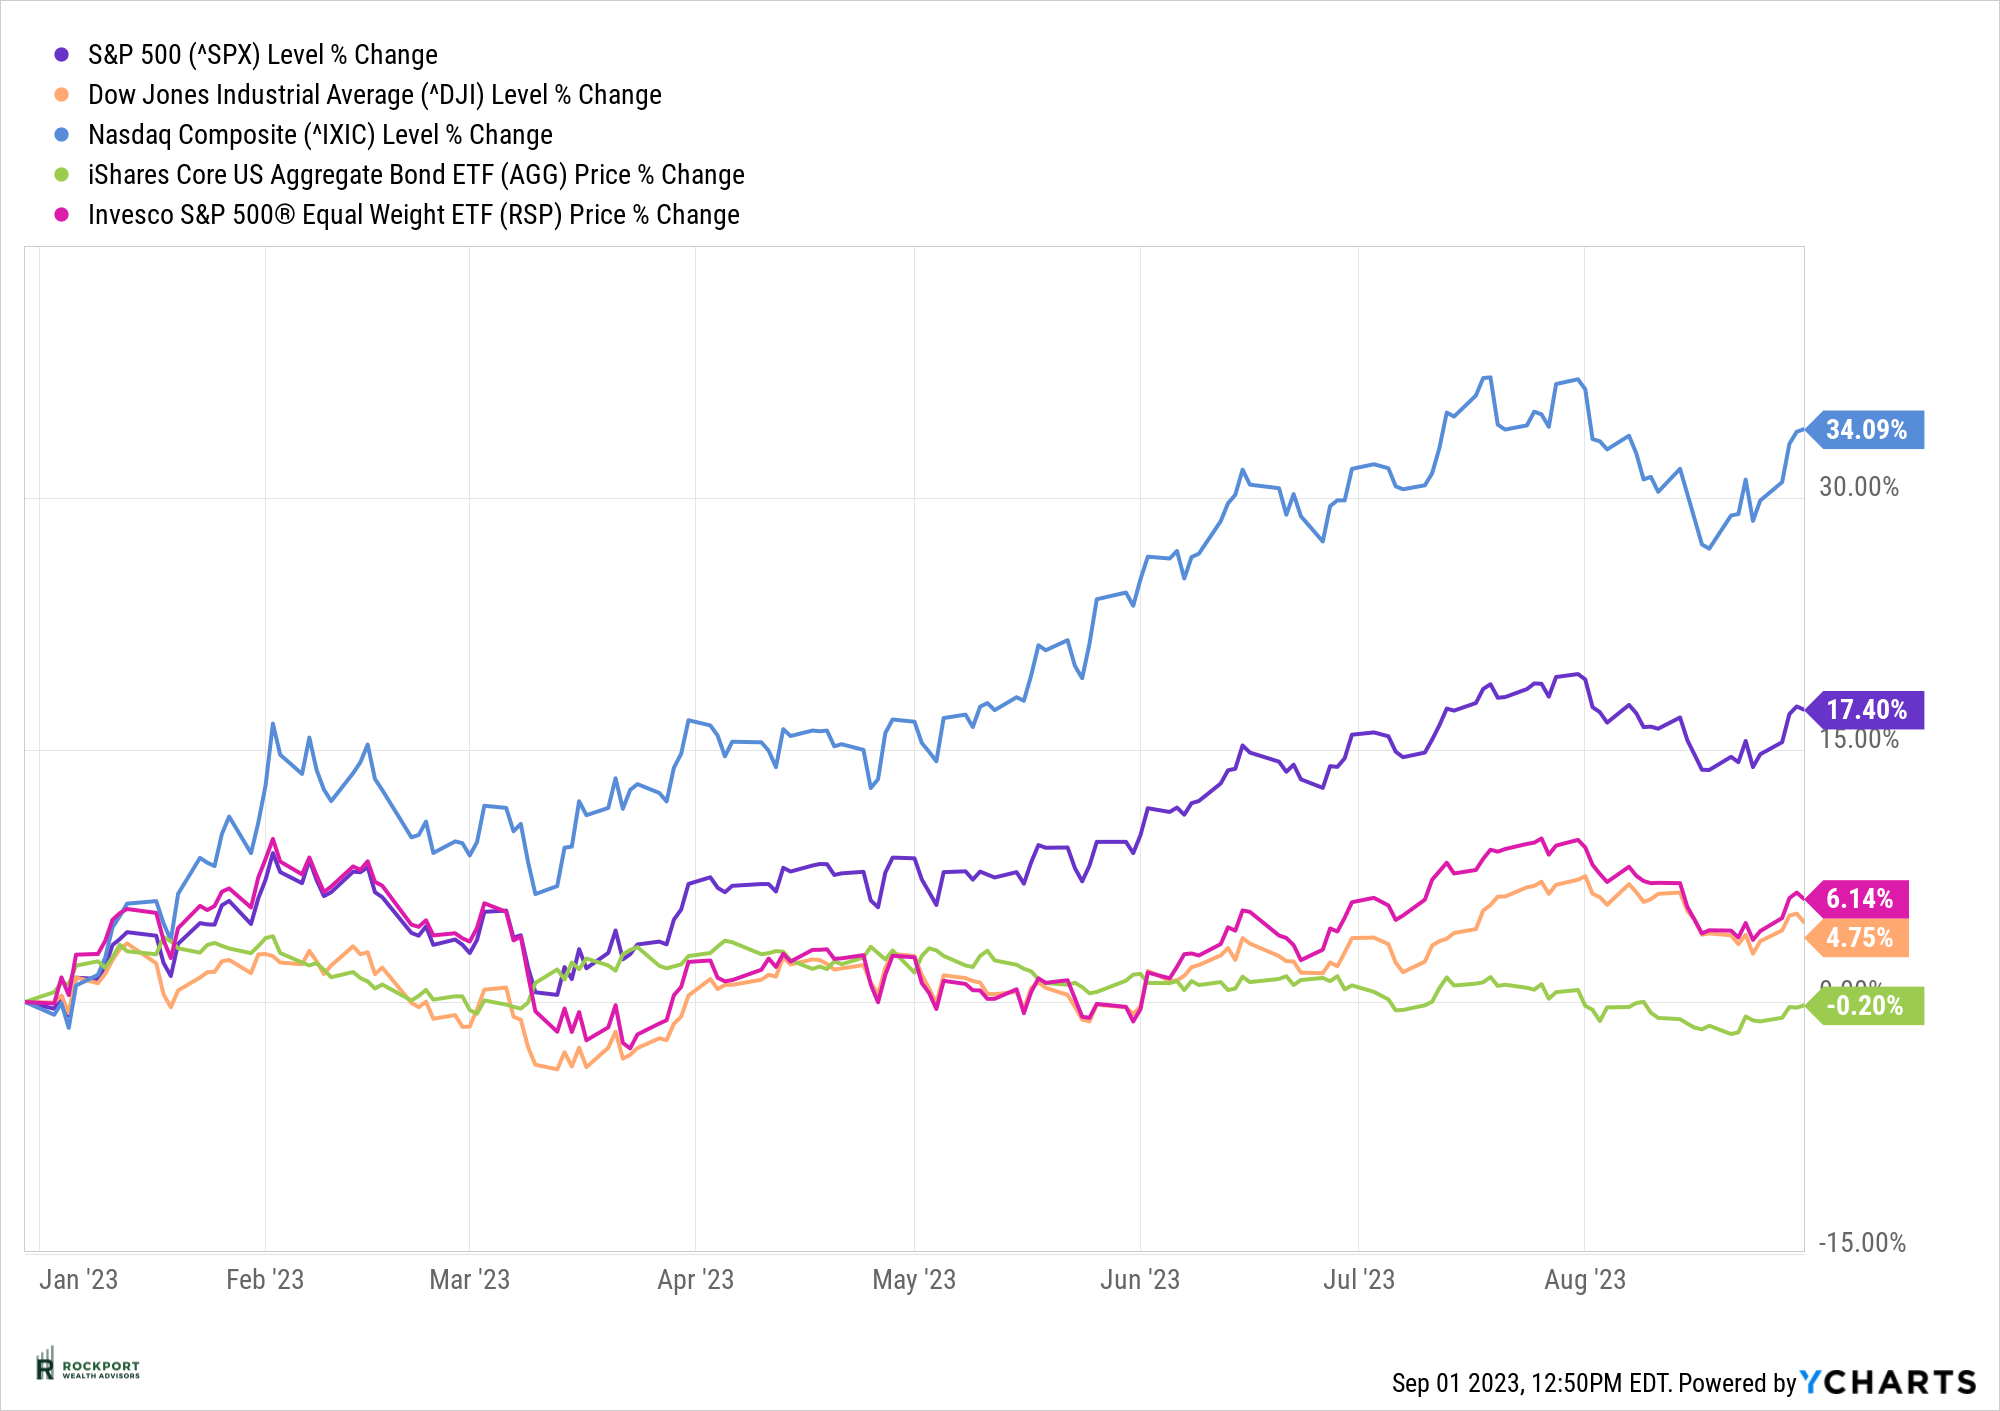
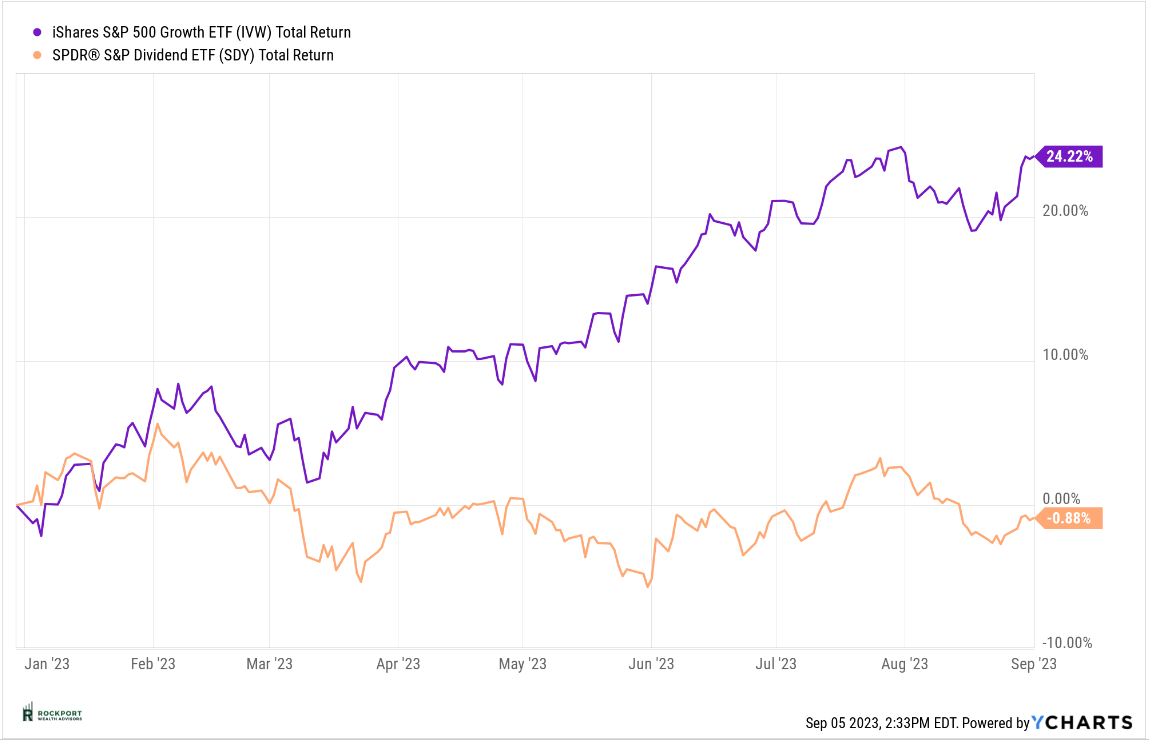
All that being said, we did escape August with a minimal decline. The S&P 500 was down 1.77% for the month. This is not terribly surprising given the strong rise in the handful of stocks we have been mentioning for months now. Inevitably there is always a cooling off period. With a slight decline for the month, the index now stands at +17.40% year to date. We have also mentioned the need for the markets to broaden out and have more stocks participate in the uptrend and in August the exact opposite happened as the S&P 500 Equal Weight index underperformed its non-equal weight partner by -1.43%. Simply put, even though the overall market was down, and the magnificent 7-10 stocks were as well, they were still down less than the broader market. So the fascination with anything AI (Artificial Intelligence) continues. In addition, the spread between growth stocks and value stocks has once again widened which is generally not a healthy sign.
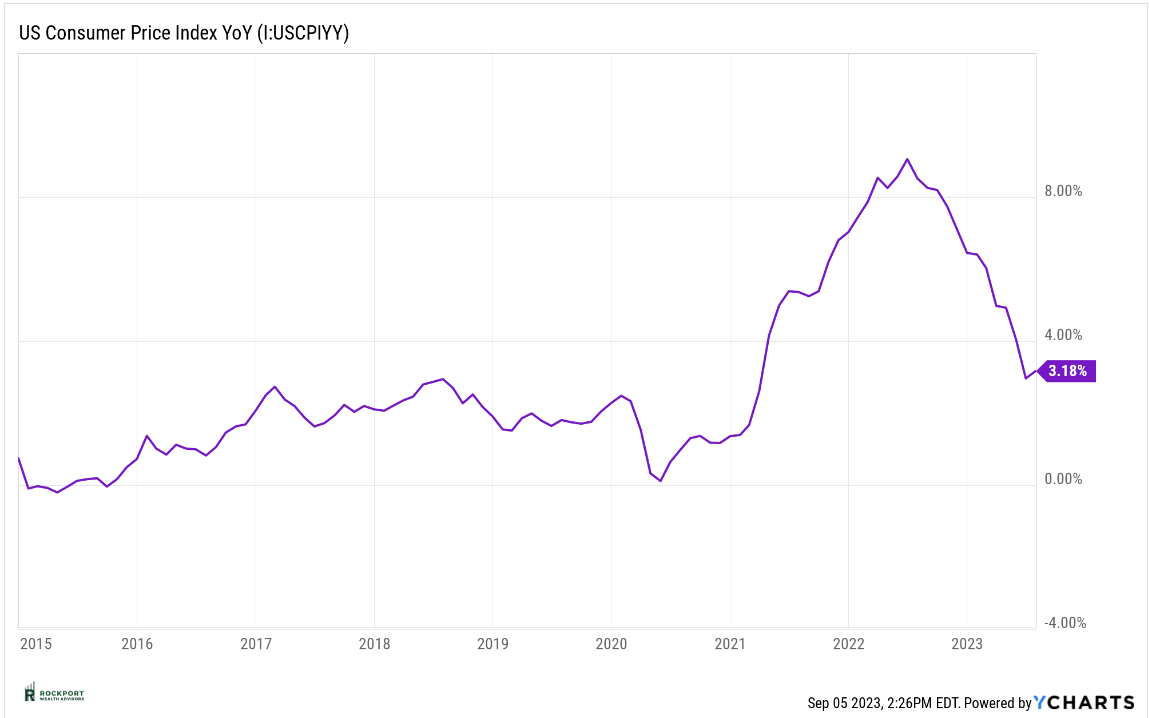
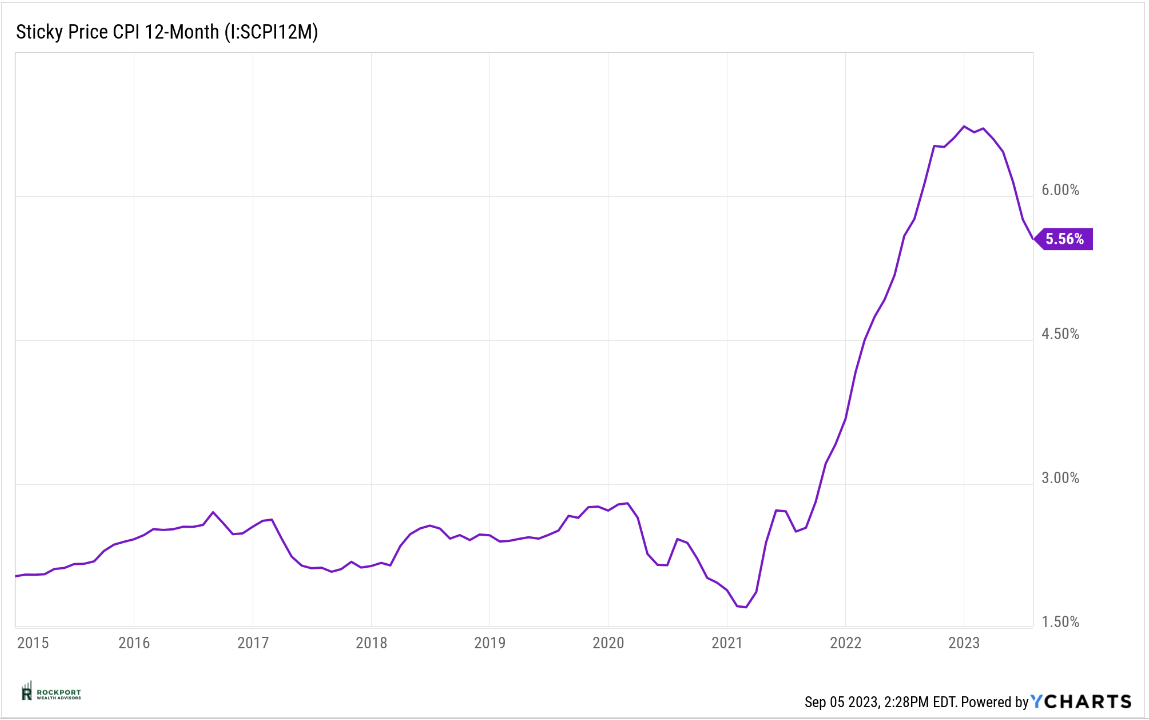
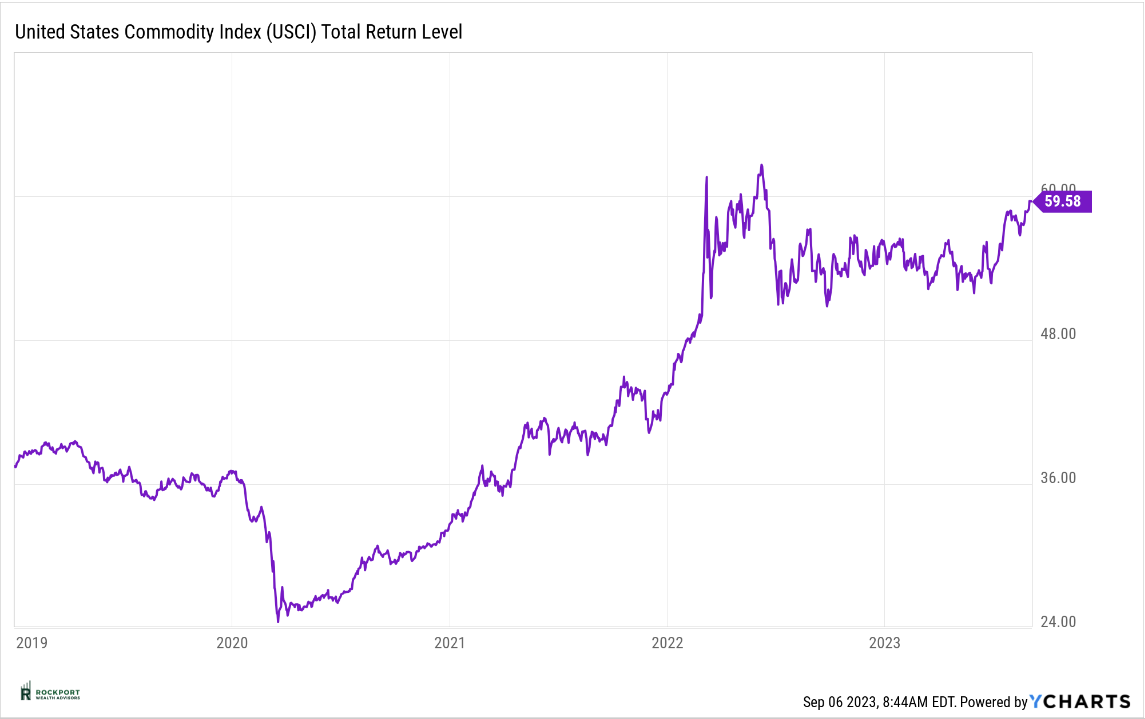
In a somewhat interesting turn of events, Inflation as measured by the CPI (Consumer Price Index) increased from 2.97% last month to 3.18%. We did note last month that price increases were starting to show in some areas. You can see the increase in commodity prices since July in the US Commodity Index chart below. In fact, they are approaching the highs from early 2022 when the Federal Reserve began raising interest rates. Oil in particular has increased in price but in addition so have prices of cotton, soybean oil, live cattle and copper. This is a trend that is clearly worth watching closely and is not going to help prices paid for goods. Even though these components do not represent a large percentage of the CPI, they are still part of the calculation. The last thing the Federal Reserve wants to see at this point is the CPI back in a sustained uptrend. This would lead to further interest rate increases. Sticky CPI is still elevated with its most recent reading at 5.56% down from 5.76% last month.
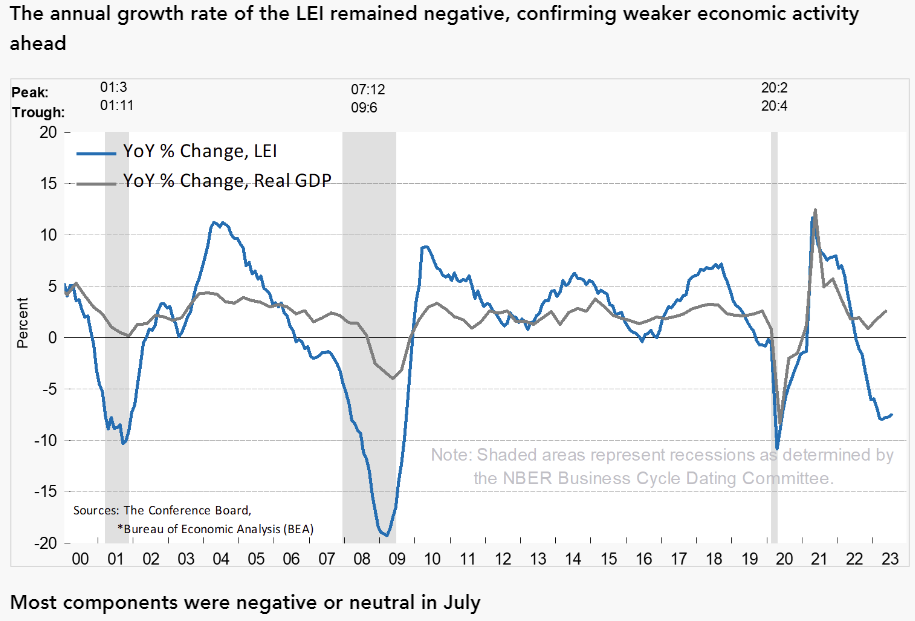
At present time, we remain on recession watch. The lag we have spoken about in last year’s interest rate increases is just starting to hit the system. The Leading Economic Index has made another new low. This marks the 16th straight month of a decline in that index. Here is The Conference Board’s most recent commentary, “The US LEI—which tracks where the economy is heading—fell for the sixteenth consecutive month in July, signaling the outlook remains highly uncertain” said Justyna Zabinska-La Monica, Senior Manager, Business Cycle Indicators, at The Conference Board. “On the other hand, the coincident index (CEI)—which tracks where economic activity stands right now—has continued to grow slowly but inconsistently, with three of the past six months not changing and the rest increasing. As such, the CEI is signaling that we are currently still in a favorable growth environment. However, in July, weak new orders, high interest rates, a dip in consumer perceptions of the outlook for business conditions, and decreasing hours worked in manufacturing fueled the leading indicator’s 0.4 percent decline. The leading index continues to suggest that economic activity is likely to decelerate and descend into mild contraction in the months ahead. The Conference Board now forecasts a short and shallow recession in the Q4 2023 to Q1 2024 timespan.”
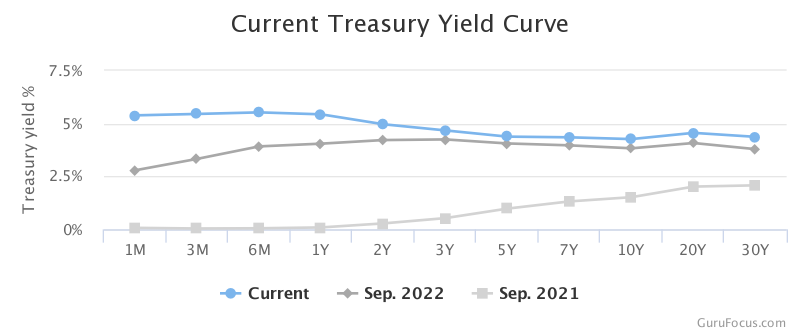
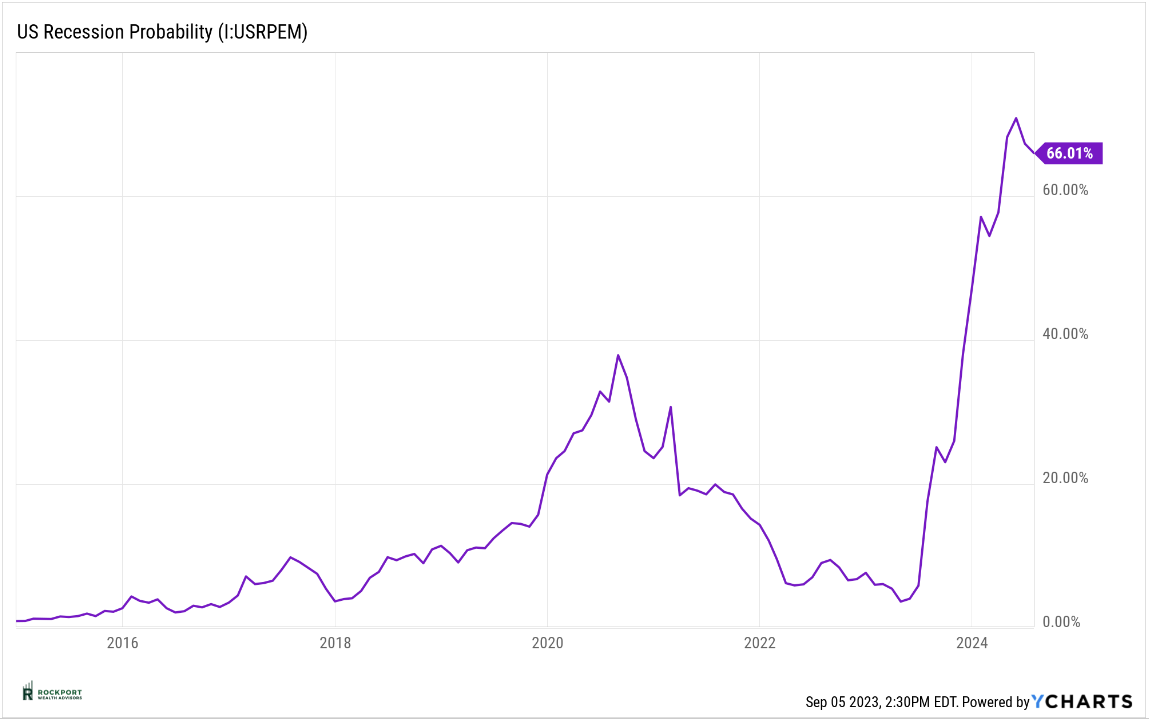
Lastly the yield curve is still inverted and has not shown signs of improvement. All of the above have a very good track record of predicting recessions. Time will tell. Oh, and the New York Feds recession probability model that we have been watching did decline ever so slightly to 66.01% from 67.31%. Still very near all time highs. Maybe it’s different this time and all of these indicators will be false signals? We certainly hope for that but would not bet on it.
Rockport Models
There were no changes to model portfolios during the month.
Industry Topics
Student Loan Payments
There has been a lot of talk in the media about Student Loan repayments. Interest on Student Loans resumed September 1st and required payments will start up again in October. This has been on pause for more than 3 years. So, what does this mean? Well, it’s tough to tell but with the average payment over $400 per month that will certainly pull money away from the economy as it won’t be able to be spent on other things. One thing that has kept us out of a recession has been consumer spending. It has been incredibly resilient and strong. Put this one in the to be determined category as we will watch the consumer spending numbers a little more closely in the months ahead to see if there is any residual effects.
Rockport News
Thank You!
Thanks for all your support as this year’s Salute To Service Golf Outing was a huge success. We managed to raise just over $25,000 for our two primary charities, The National Veterans Memorial and Museum, and The Gallant Few. This was our 3rd year of hosting this event and each year has gotten better and better! Click the link below to see photo’s from this years event.
2023 Salute To Service Photo Gallery
As always, if you have any questions on anything we have talked about here or anything else that is on your mind, please feel free to reach out.
*The Standard & Poor’s 500 (S&P 500) is an unmanaged group of securities considered to be representative of the stock market in general. Results can be found at slickcharts.com.
*Treasury yields can be found at finance.yahoo.com.
*Charts produced at yCharts.com
*Bonds can be found at bloomberg.com/markets/rates-bonds
*Fed Rate Probability Chart can be found at cmegroup.com/markets/interest-rates/cme-fedwatch-too
*The LEI can be found at conference-board.org/topics/us-leading-indicators
*Treasury Yield Curve can be found at Gurufocus.com
*Rockport Models – Please remember we are referencing our model portfolios, and your portfolio may differ from the models mentioned depending on your individual needs and circumstance.