Jon Arnold’s View Point
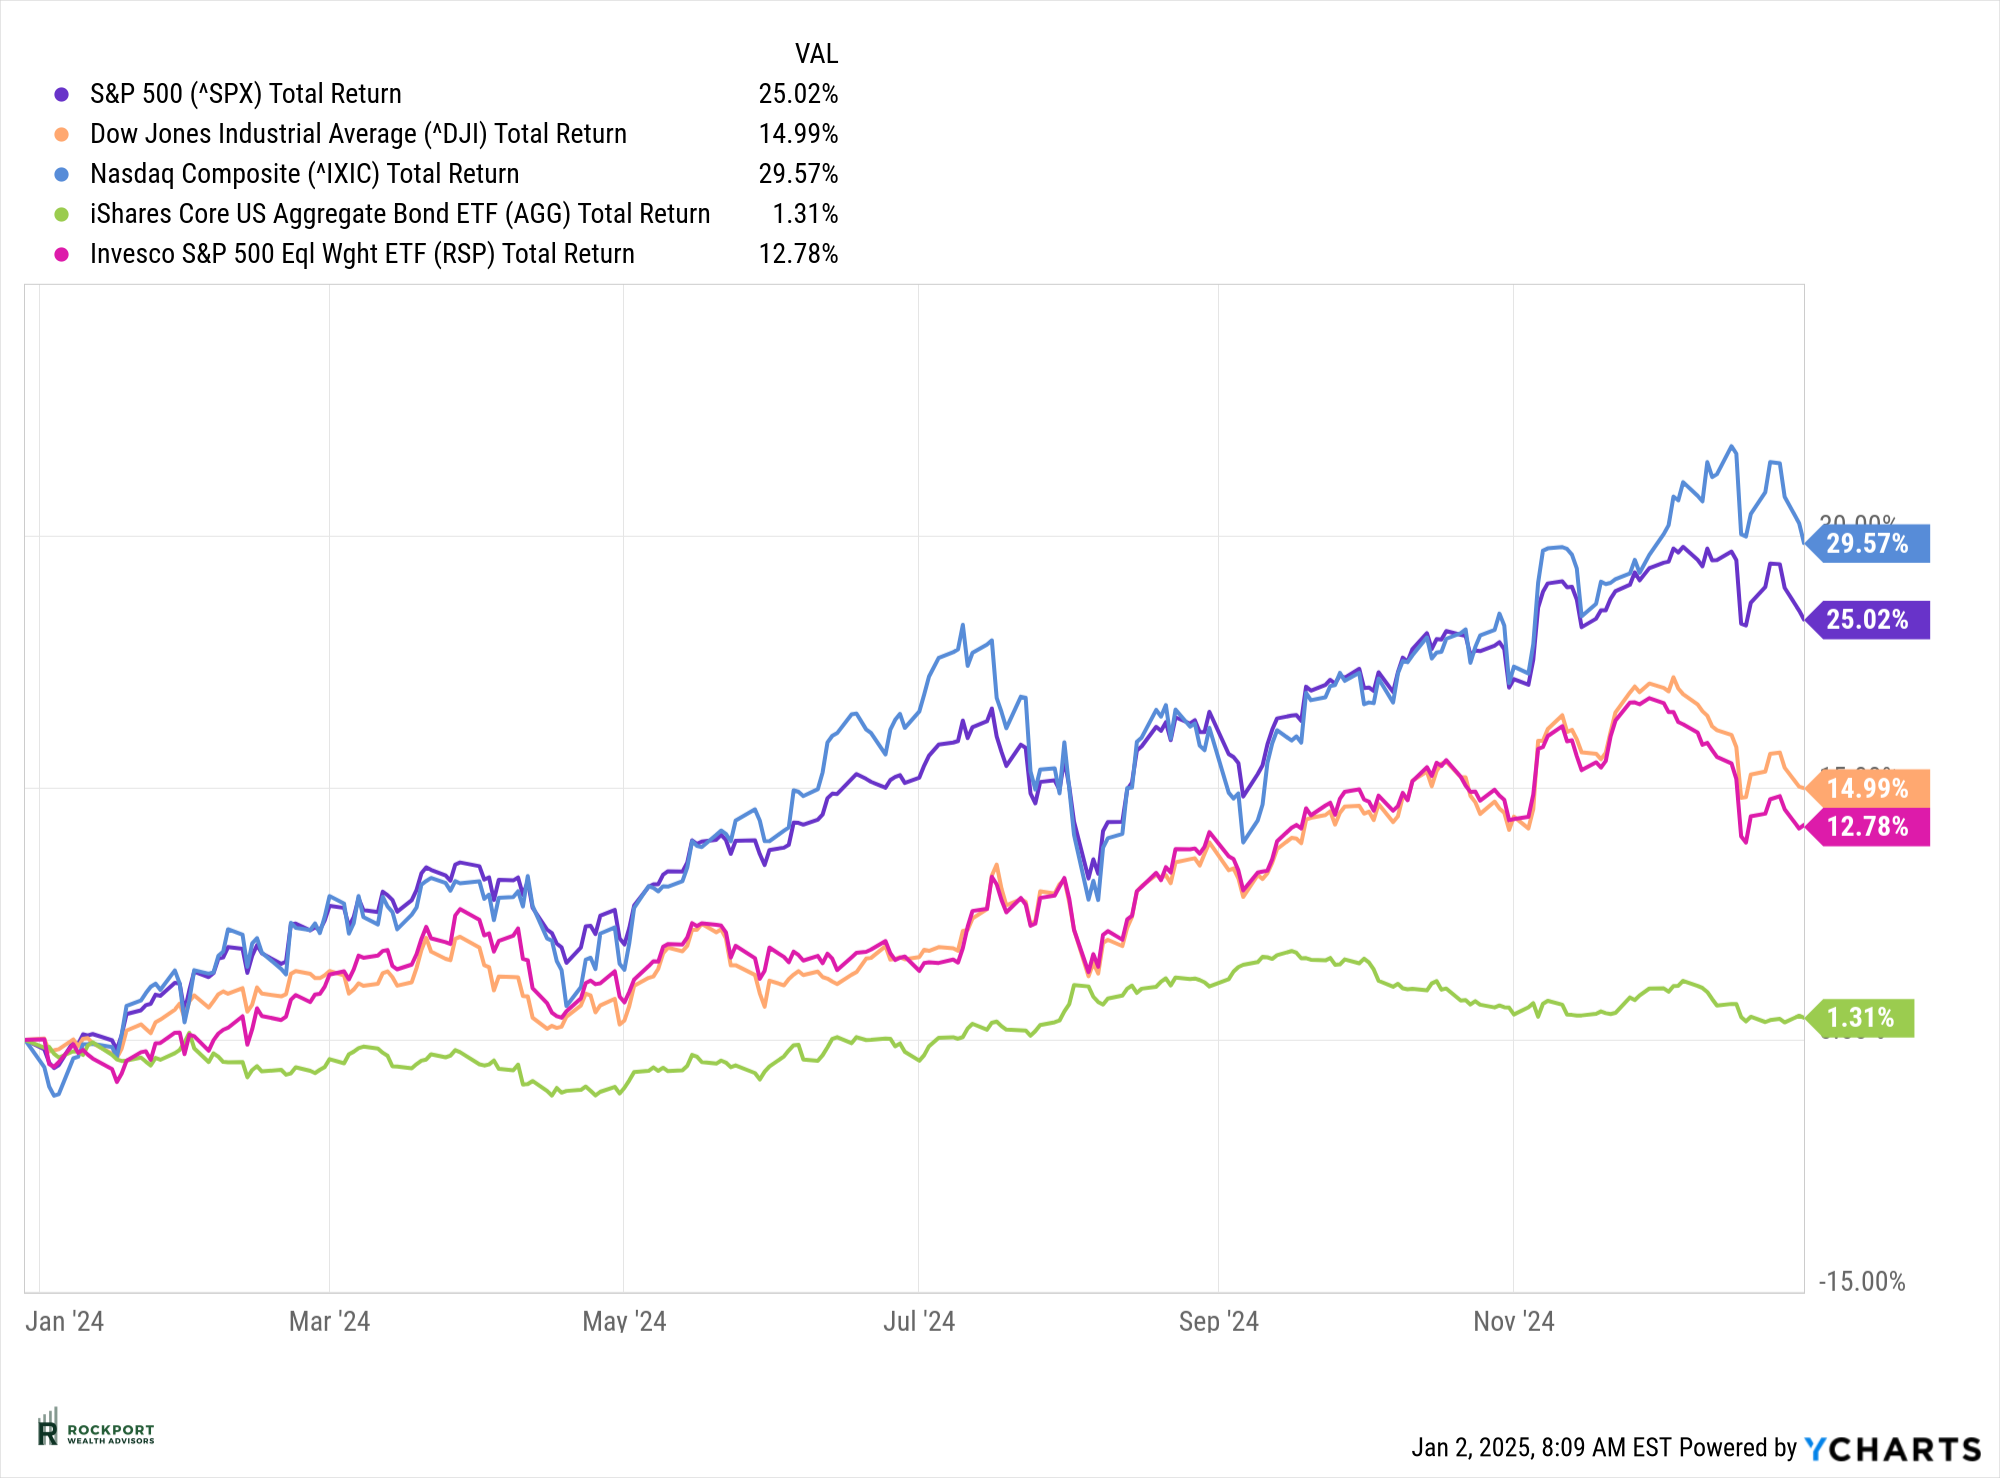
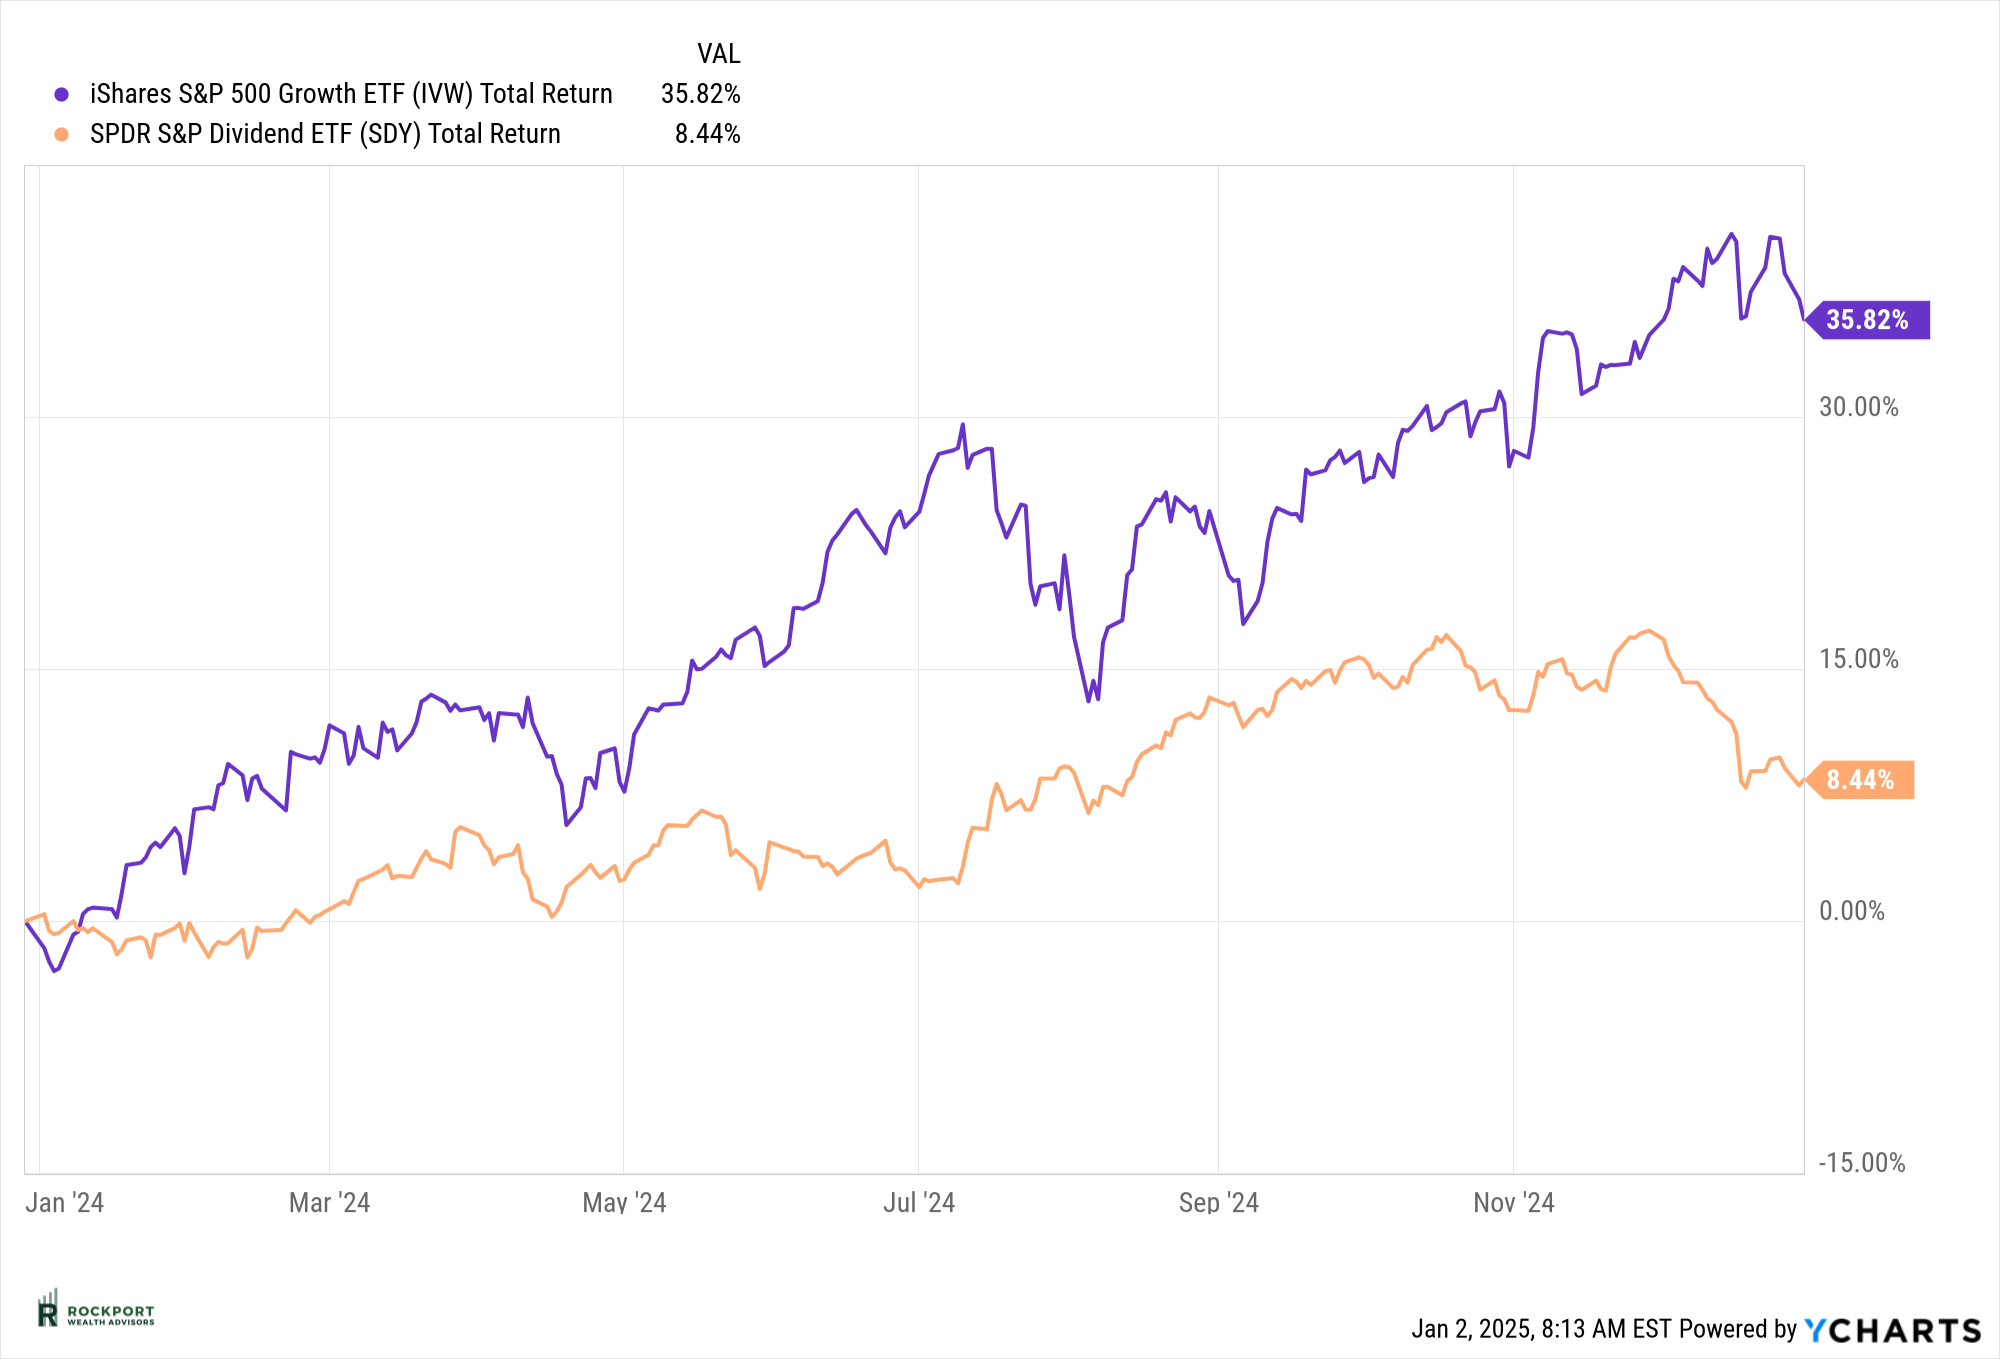
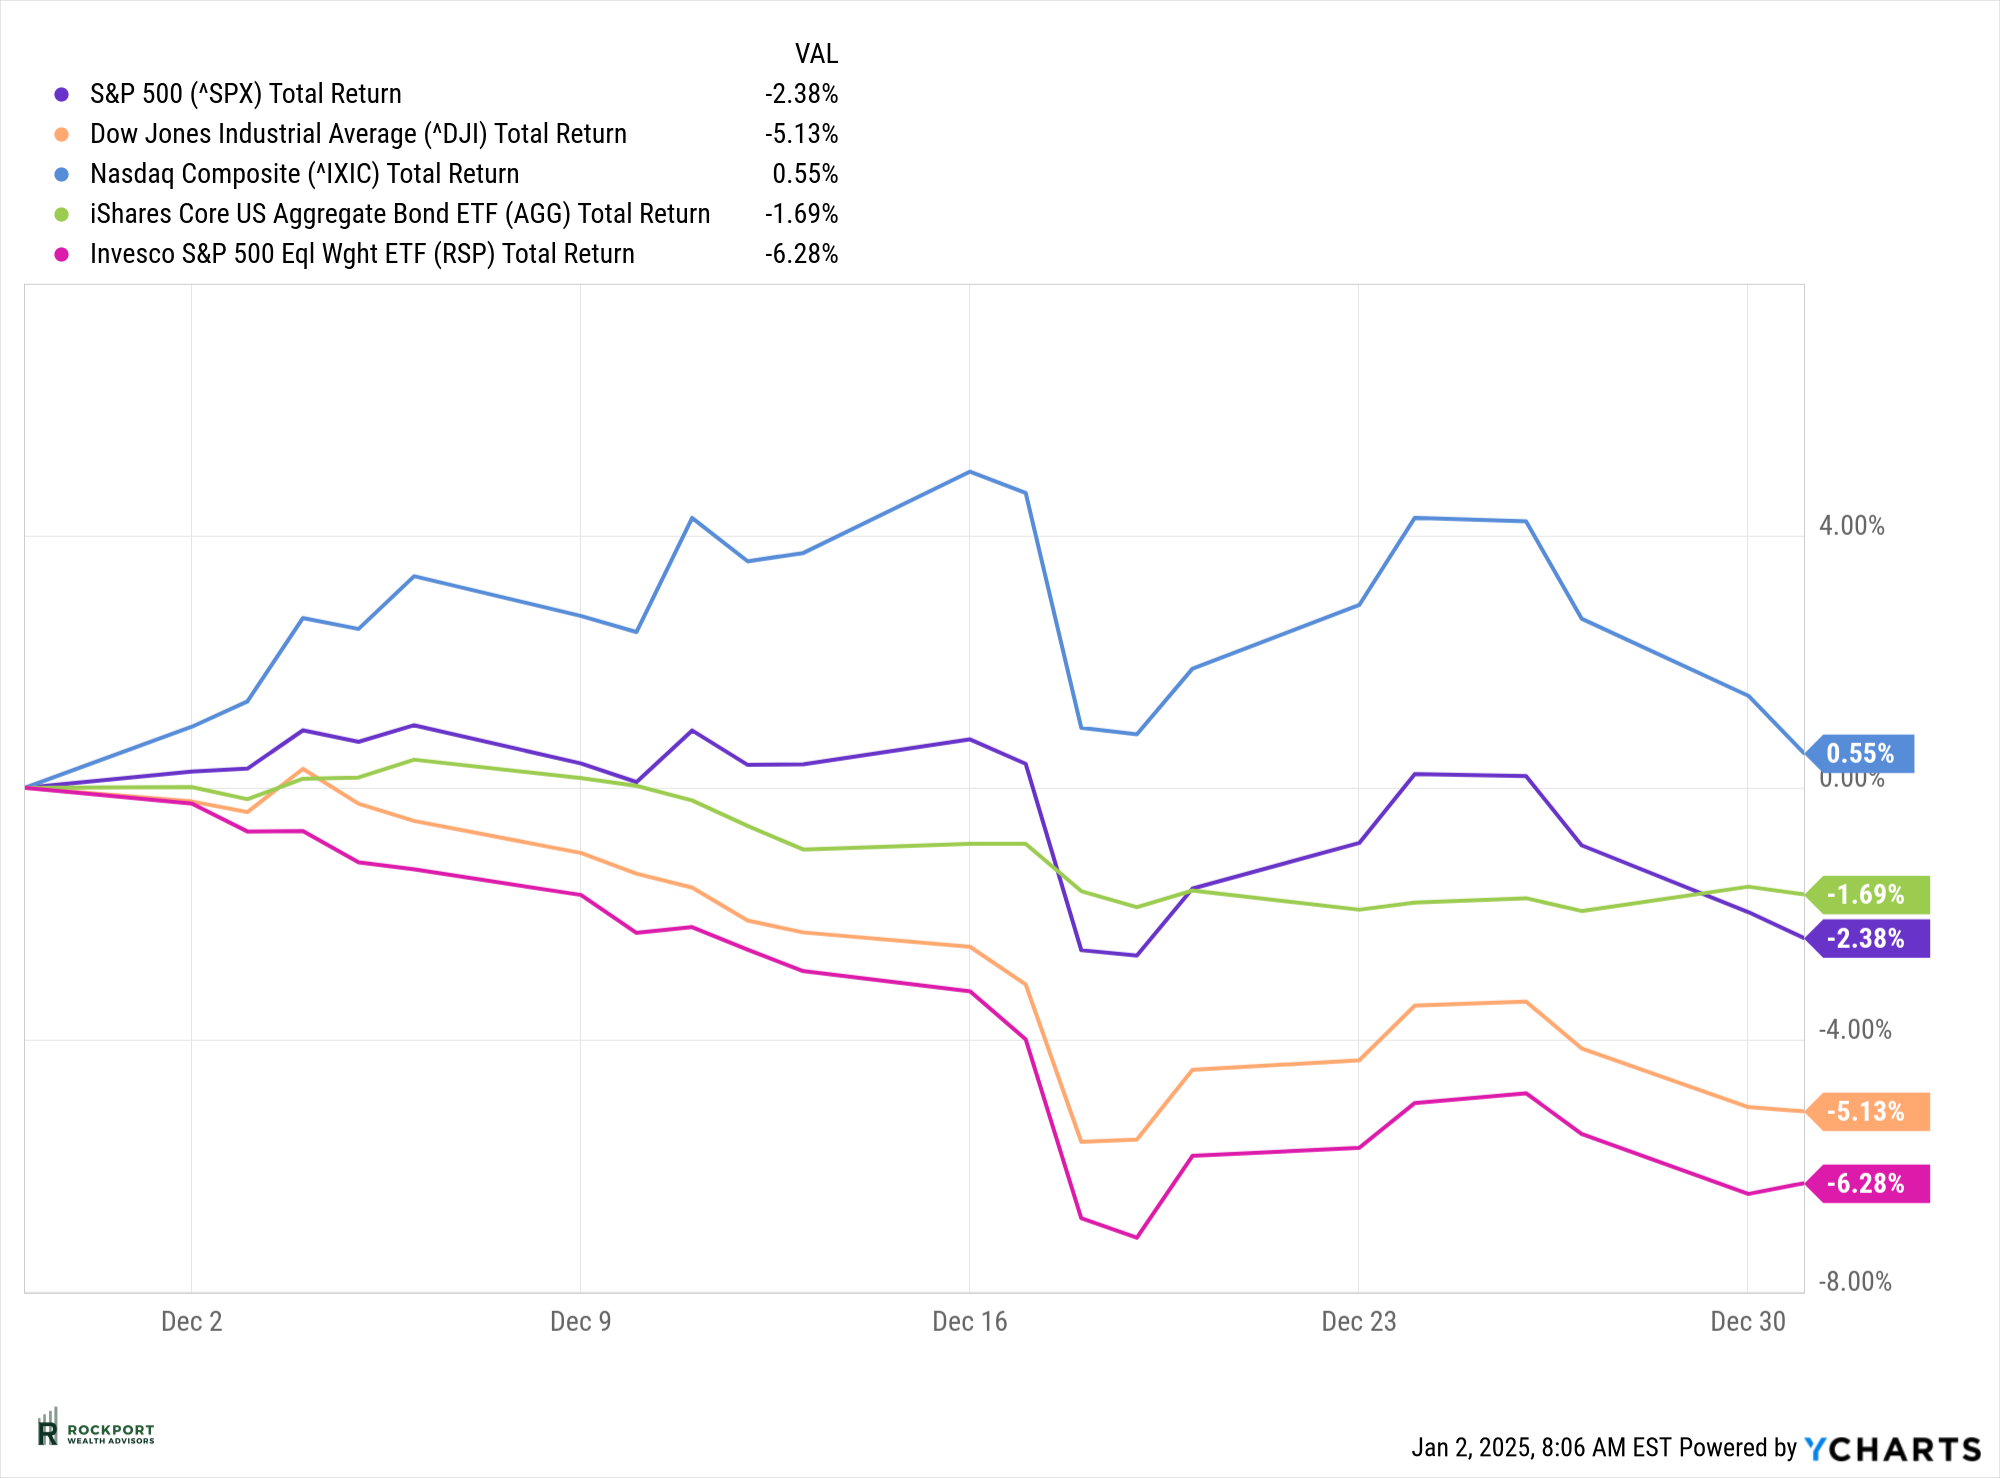
As we kick off the new year, we’re seeing a broad market sell-off, particularly in areas that struggled in December, such as the overall market and growth stocks. However, there’s some positive news as well—many individual stocks are showing signs of strength, with some resilient names hitting new highs, and others bouncing back after recent dips. This is encouraging, but it’s important to remember that early January can be volatile, with sharp moves in both directions.
Looking at the bigger picture, the intermediate-term trend for most indexes and key measures remains neutral to negative. There’s a lot of mixed movement among individual stocks—some are selling off, while others are strengthening. What does this mean for you? Thus far, our decision to move toward safe, high-quality, dividend-paying equities has proven to be the right one.
It’s very rare, and I mean red as rare can be, that the market sees back-to-back years of double-digit returns. If you need a reminder, just look at 2022. With this in mind, we should expect a potentially volatile year, as we’ve already seen two years of exceptional returns.
Our strategy will stay consistent unless we see a clear market bottom or a significant buying opportunity, like a 20% drop in a stock such as Apple (just a hypothetical example).
For 2025, I’m focused on sectors like medical devices, nuclear energy powering AI, and cybersecurity, which appear to be strong potential leaders in the markets.
As we enter 2025, several key factors are shaping the financial landscape. Inflation is currently on the rise and remains above the Federal Reserve’s 2% target. Despite recent interest rate cuts, bond yields are climbing, reflecting ongoing market adjustments. Stock market valuations are hovering near all-time highs, with momentum—particularly driven by the performance of the top 10 stocks—continuing to play a significant role. Additionally, changes in market structure are emerging as another area of concern, which we’ll explore further later in this newsletter.
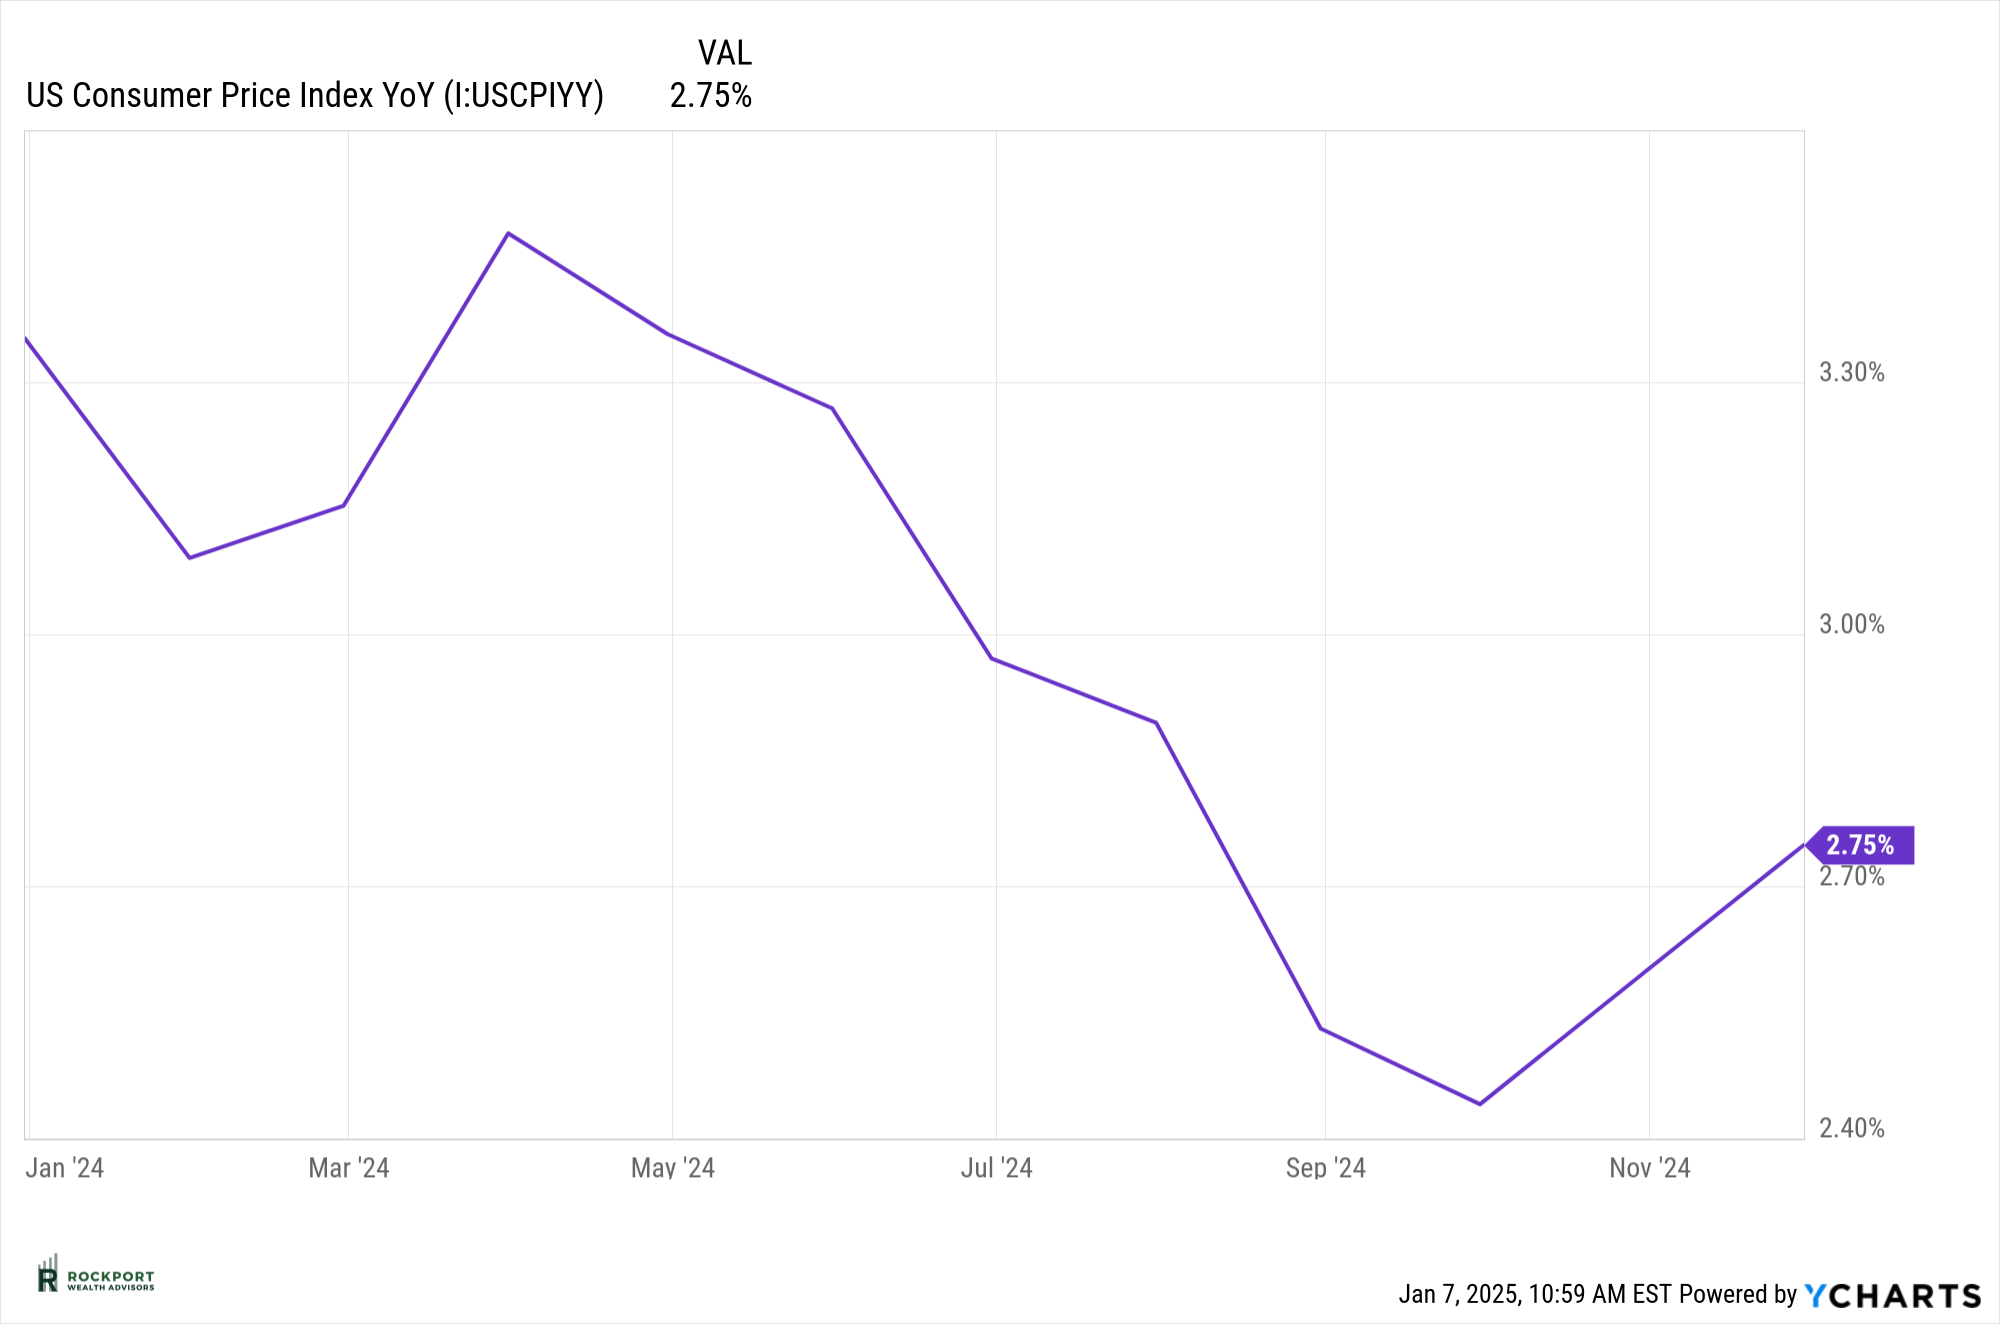
While inflation was lower overall in 2024, it has been climbing again recently, as shown by the Consumer Price Index (CPI). This trend is concerning for the Federal Reserve, as it goes against their goal of bringing inflation under control. The Fed cut interest rates by a full 1% last year, but these cuts may actually be contributing to the renewed rise in inflation.
In a worst-case scenario, the Fed might have to halt further rate cuts and even reverse course by raising interest rates again to fight inflation. While this isn’t the most likely outcome, such an unexpected move could significantly disrupt the markets.
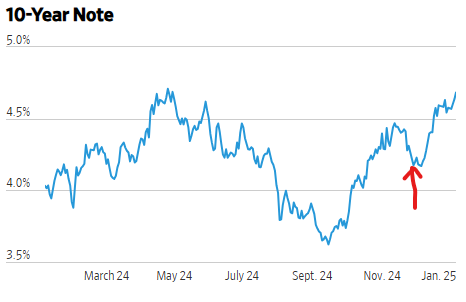
The 10-year Treasury note yield has been rising steadily, as shown in the chart below. The red arrow highlights where the yield was at the time of last month’s newsletter and the significant increase since then. This upward movement is not a welcome development, as higher yields create competition for stocks, particularly as they approach the 5% range. Last month, we were hoping for continued declines in yields, which would have been a positive signal for the markets. Unfortunately, yields have risen sharply over the past month. This increase is also a signal from the bond market that it expects more inflation ahead—another trend that runs counter to the Federal Reserve’s current goals.
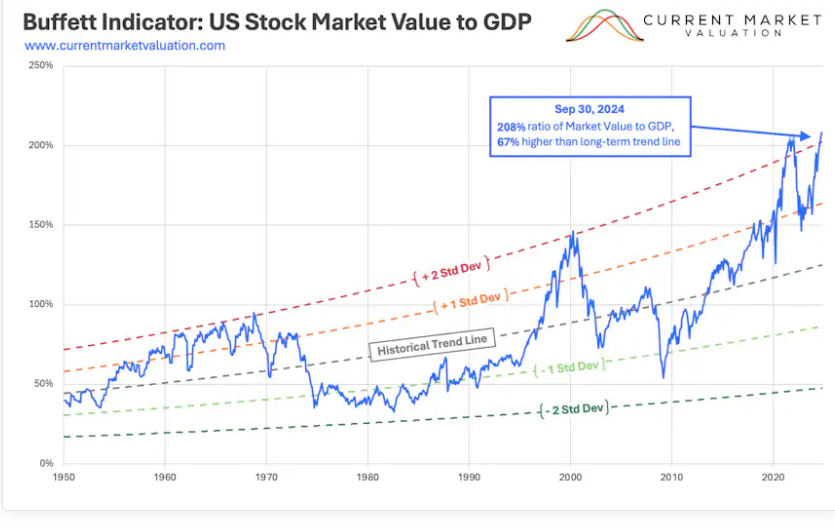
 As we mentioned last month, market valuations remain at historic highs. To provide further context, we’re sharing an updated view of the Buffett Indicator. While it’s still at an all-time high, this chart shows that the current level is two standard deviations above the historical trend line. Historically, when the indicator has been this stretched, stocks have faced challenges. While there’s no reason to believe this time will be different, the timing and extent of any potential market impact remain uncertain.
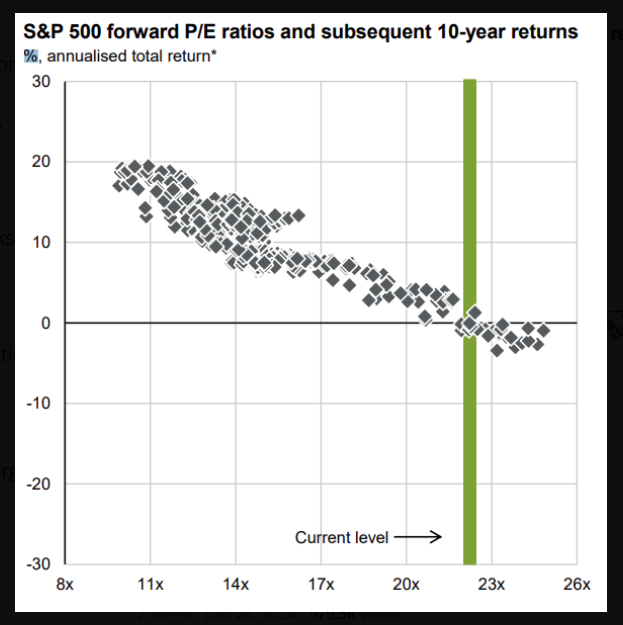
Additionally, the second chart below highlights the S&P 500’s forward-looking returns based on the current forward price-to-earnings (P/E) ratio. At roughly 23x forward earnings (shown by the green line), historical returns from similar levels have been modest to flat. Simply put, when markets are this expensive, generating high returns in stocks becomes difficult—but not impossible.
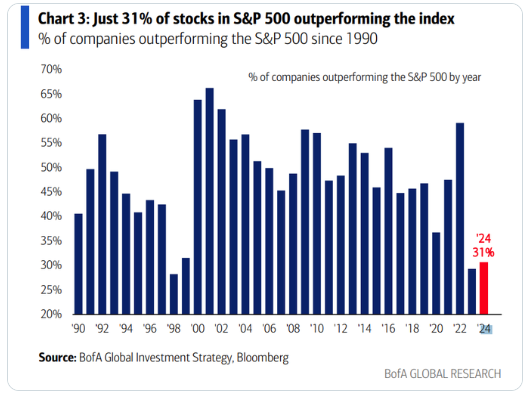
Momentum in the markets is clearly reflected in the charts below. One shows the percentage of stocks outperforming the S&P 500 index, and the other highlights the concentration of the top 10 stocks, which now make up 40% of the index. This illustrates how money has poured into these top 10 stocks throughout the year, driving their valuations even higher.
This imbalance poses a challenge for investors seeking diversification through S&P 500 index funds. Currently, 40 cents of every dollar invested in these funds goes into just 10 stocks, while the remaining 60 cents is spread across the other 490 companies. This trend accelerates the gains of these already highly valued stocks, further skewing the market.
The second chart underscores this dynamic, showing that the percentage of stocks outperforming the index is near historic lows. This highlights the extent to which the top 10 stocks dominate and drive the overall index’s performance. While leaving a lot of stocks behind and underperforming.
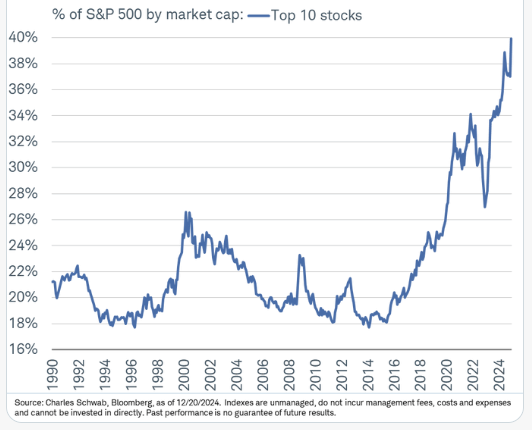
Let’s touch on market structure, an important topic that hasn’t been discussed in detail. Part of the structural issue is the concentration of the top 10 stocks, which we addressed in the previous section. This imbalance is challenging to resolve, as the dynamics of index investing continue to favor these few companies.
Another emerging factor impacting market structure is the rise of zero-day-to-expiration (0DTE) options, which now dominate options trading volumes. For those unfamiliar, these are essentially one-day bets on the movement of a stock or index. Introduced in 2022, 0DTE options have added a speculative, casino-like element to the market. While it’s unclear if they pose a long-term structural issue, they do contribute to increased single-day volatility, both on up and down days. This volatility is worth watching, particularly for its potential impact during down-market cycles.
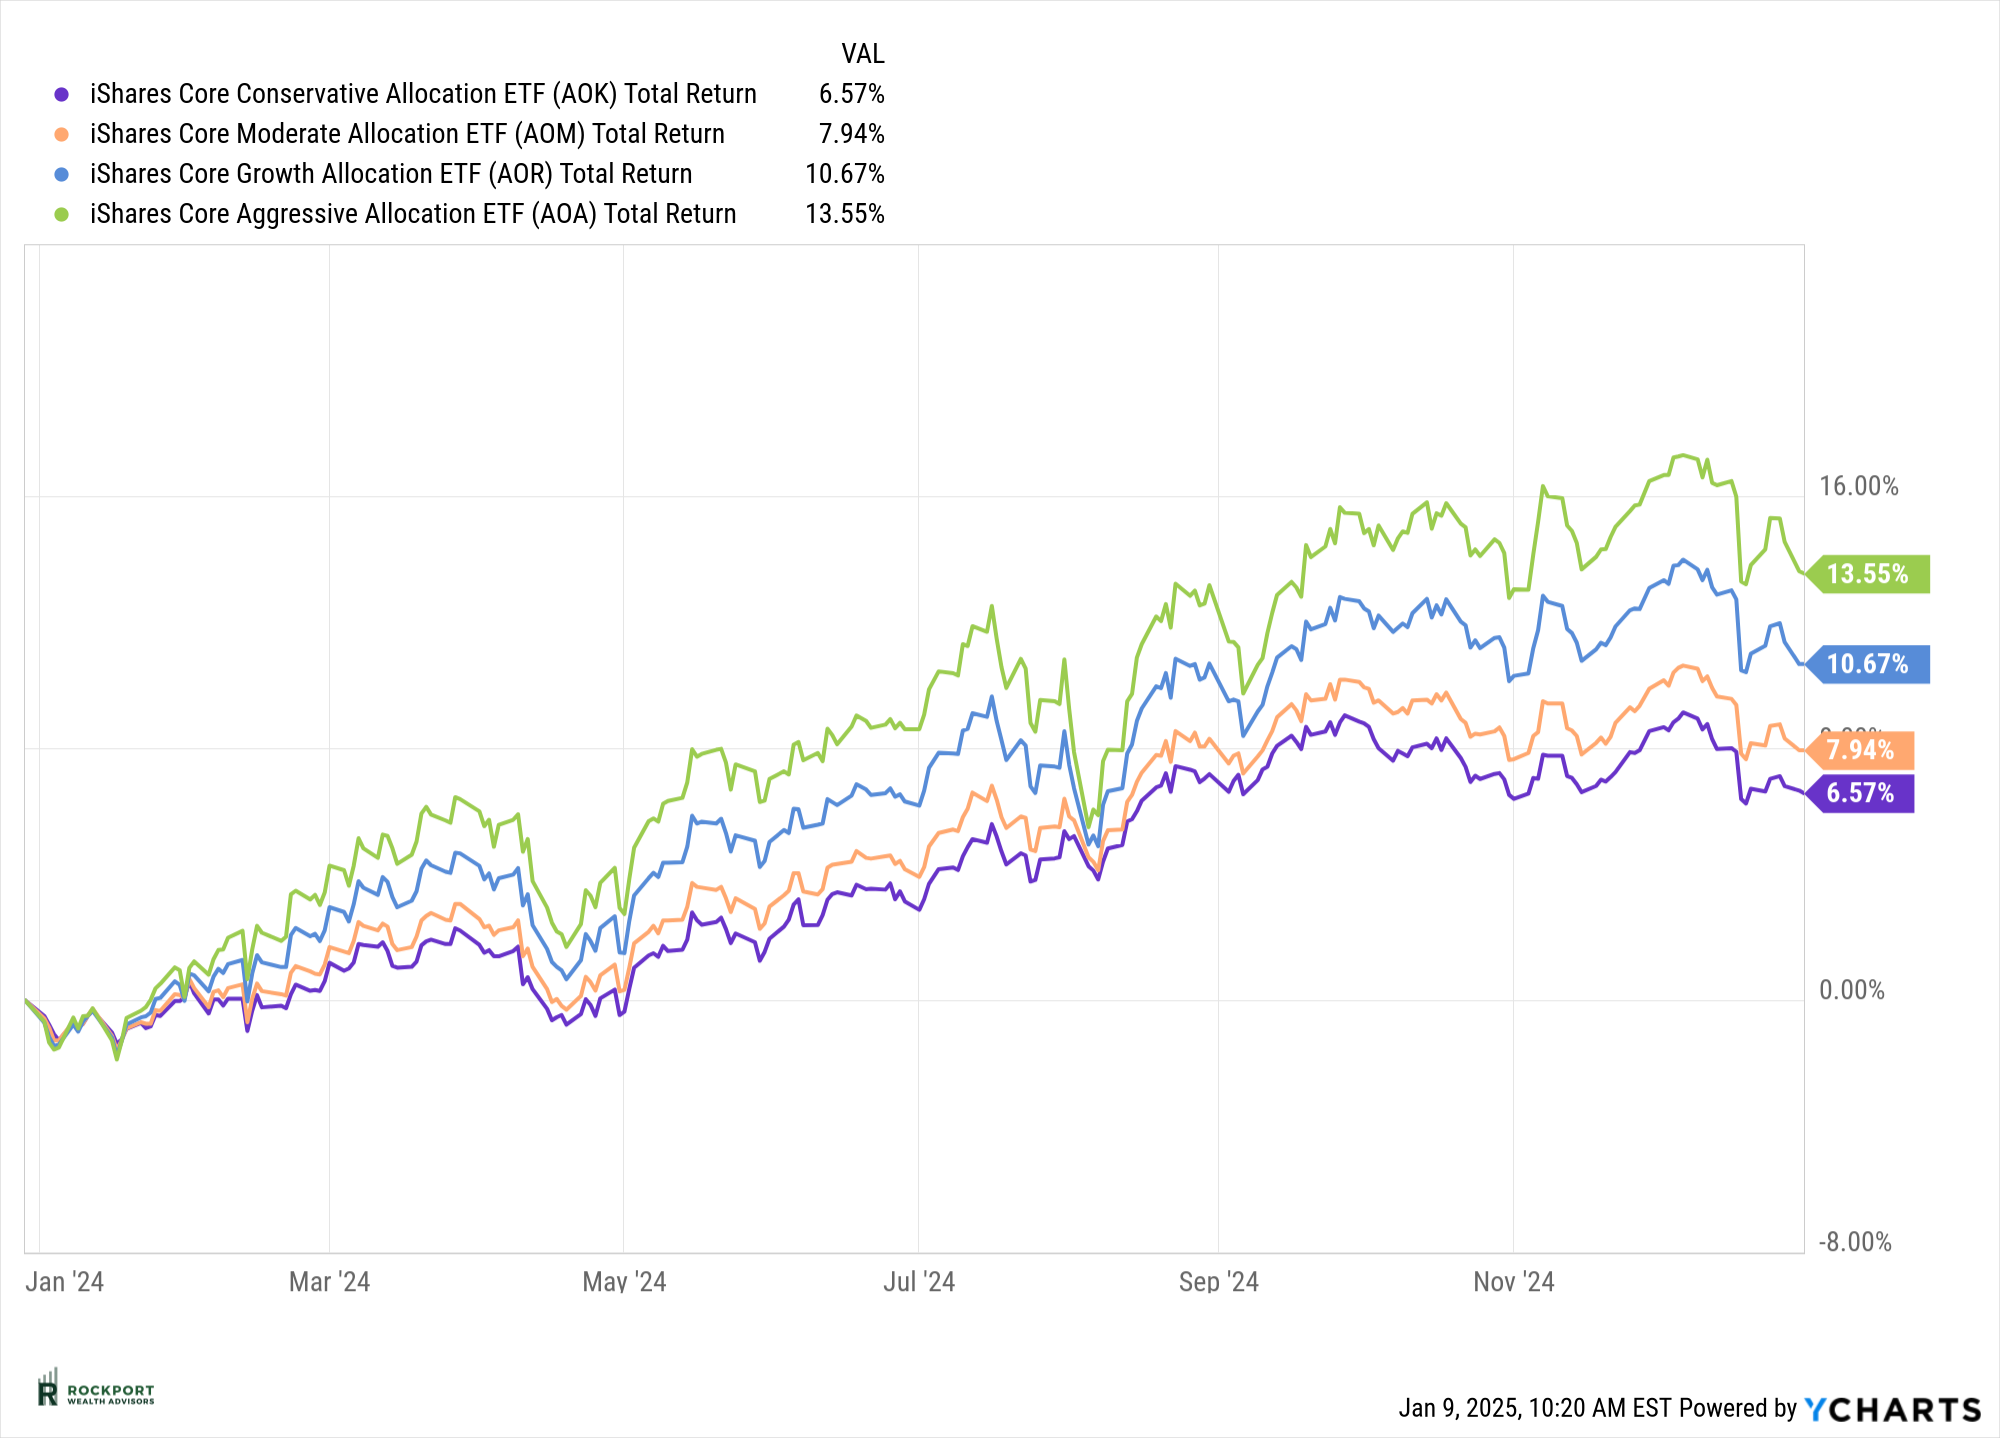
For a snapshot of how a diversified portfolio performed last year, one useful reference is the iShares Allocation ETFs. These funds represent asset allocation models that combine various indexes, including U.S. stocks (like the S&P 500), bonds, and international markets.
As shown, the returns of these diversified portfolios were significantly lower than the impressive gains of the S&P 500 alone. This reflects where most investors landed in terms of returns last year, depending on their individual risk levels. It’s important to note that these ETFs are passively managed, meaning they simply track the performance of the underlying markets rather than actively seeking to outperform them.
To wrap up, our role is to present the facts and data, without adding emotion to the process. At this point, the facts suggest that strong market performance moving forward may be challenging. However, it’s worth noting that markets have shown remarkable resilience over the past year, even in the face of questionable data. As we’ve emphasized before, markets often follow their own rhythm—sometimes, nothing matters until it matters.
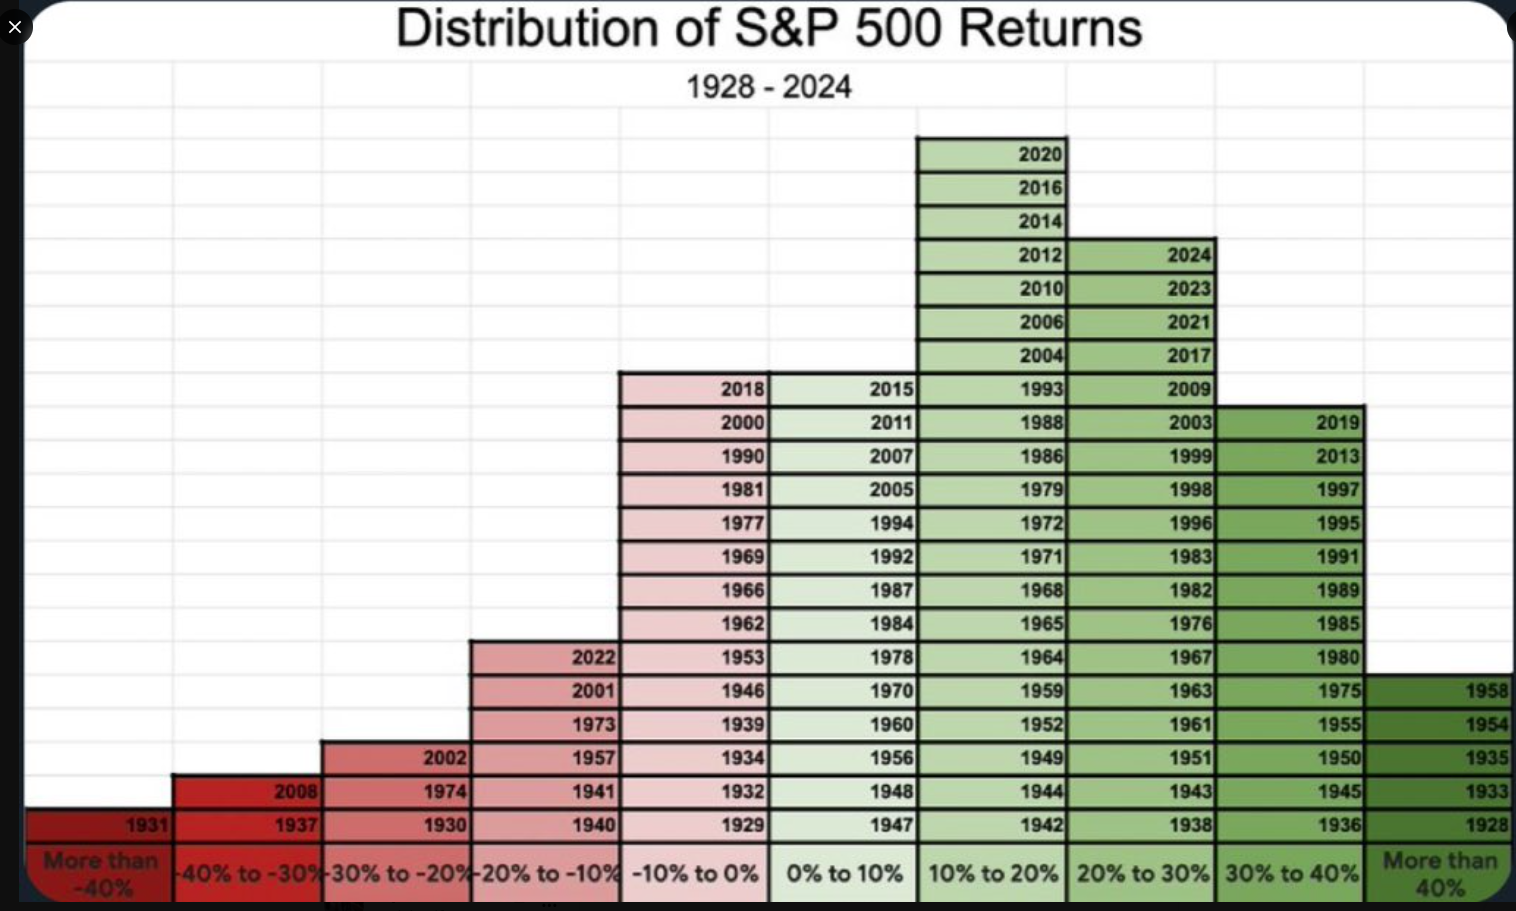
Maintaining a long-term focus is critical. The chart below illustrates that markets have historically been positive (green) far more often than negative (red) on an annual basis. Additionally, extreme highs or lows in performance are relatively uncommon.
The key to success in the weeks, months, and year ahead will be to minimize losses during any negative years (if they occur). Doing so will better position us to take full advantage of more favorable conditions when they return.
Rockport News
Axos Proxy Voting Change
For those clients that have accounts held at AXOS clearing, please note that due to a change in regulations we will no longer be able to vote your proxies for you. What does this mean? It means that periodically you may receive via mail or in some cases email a request to vote on things like boards of directors or other financial matters associated with a given security. Vote these at your discretion. Most of you have seen these before, but by all means if you have any questions please reach out.
As always, if you have any questions on anything we have talked about here or anything else that is on your mind, please feel free to reach out.

